


A Rally That Could Feed on Itself
Thoughts on the Market

2 weeks ago, we said the market wouldn’t sit around if negotiations slowed down.
After all, time is still of the essence!
So naturally, after getting hit with the same recycled “Tariff talks are going well, everyone wants to negotiate” line, the market took matters into its own hands last Monday – dumping stocks and ditching US dollars in dramatic fashion.
By causing a scene, the market reminded Trump that he hates a sell-off more than he loves a trade war.
And the same goes for his supporters, who were all for Trump’s tough-guy tactics – until they checked their 401k and thought, “...what the F!”
All of this has only pushed the White House to back off on tariffs, which is giving us some key insight into how this chicken game is actually playing out.
After misjudging the situation, it’s pretty clear by now that Trump is losing the upper hand in controlling the narrative to the market.
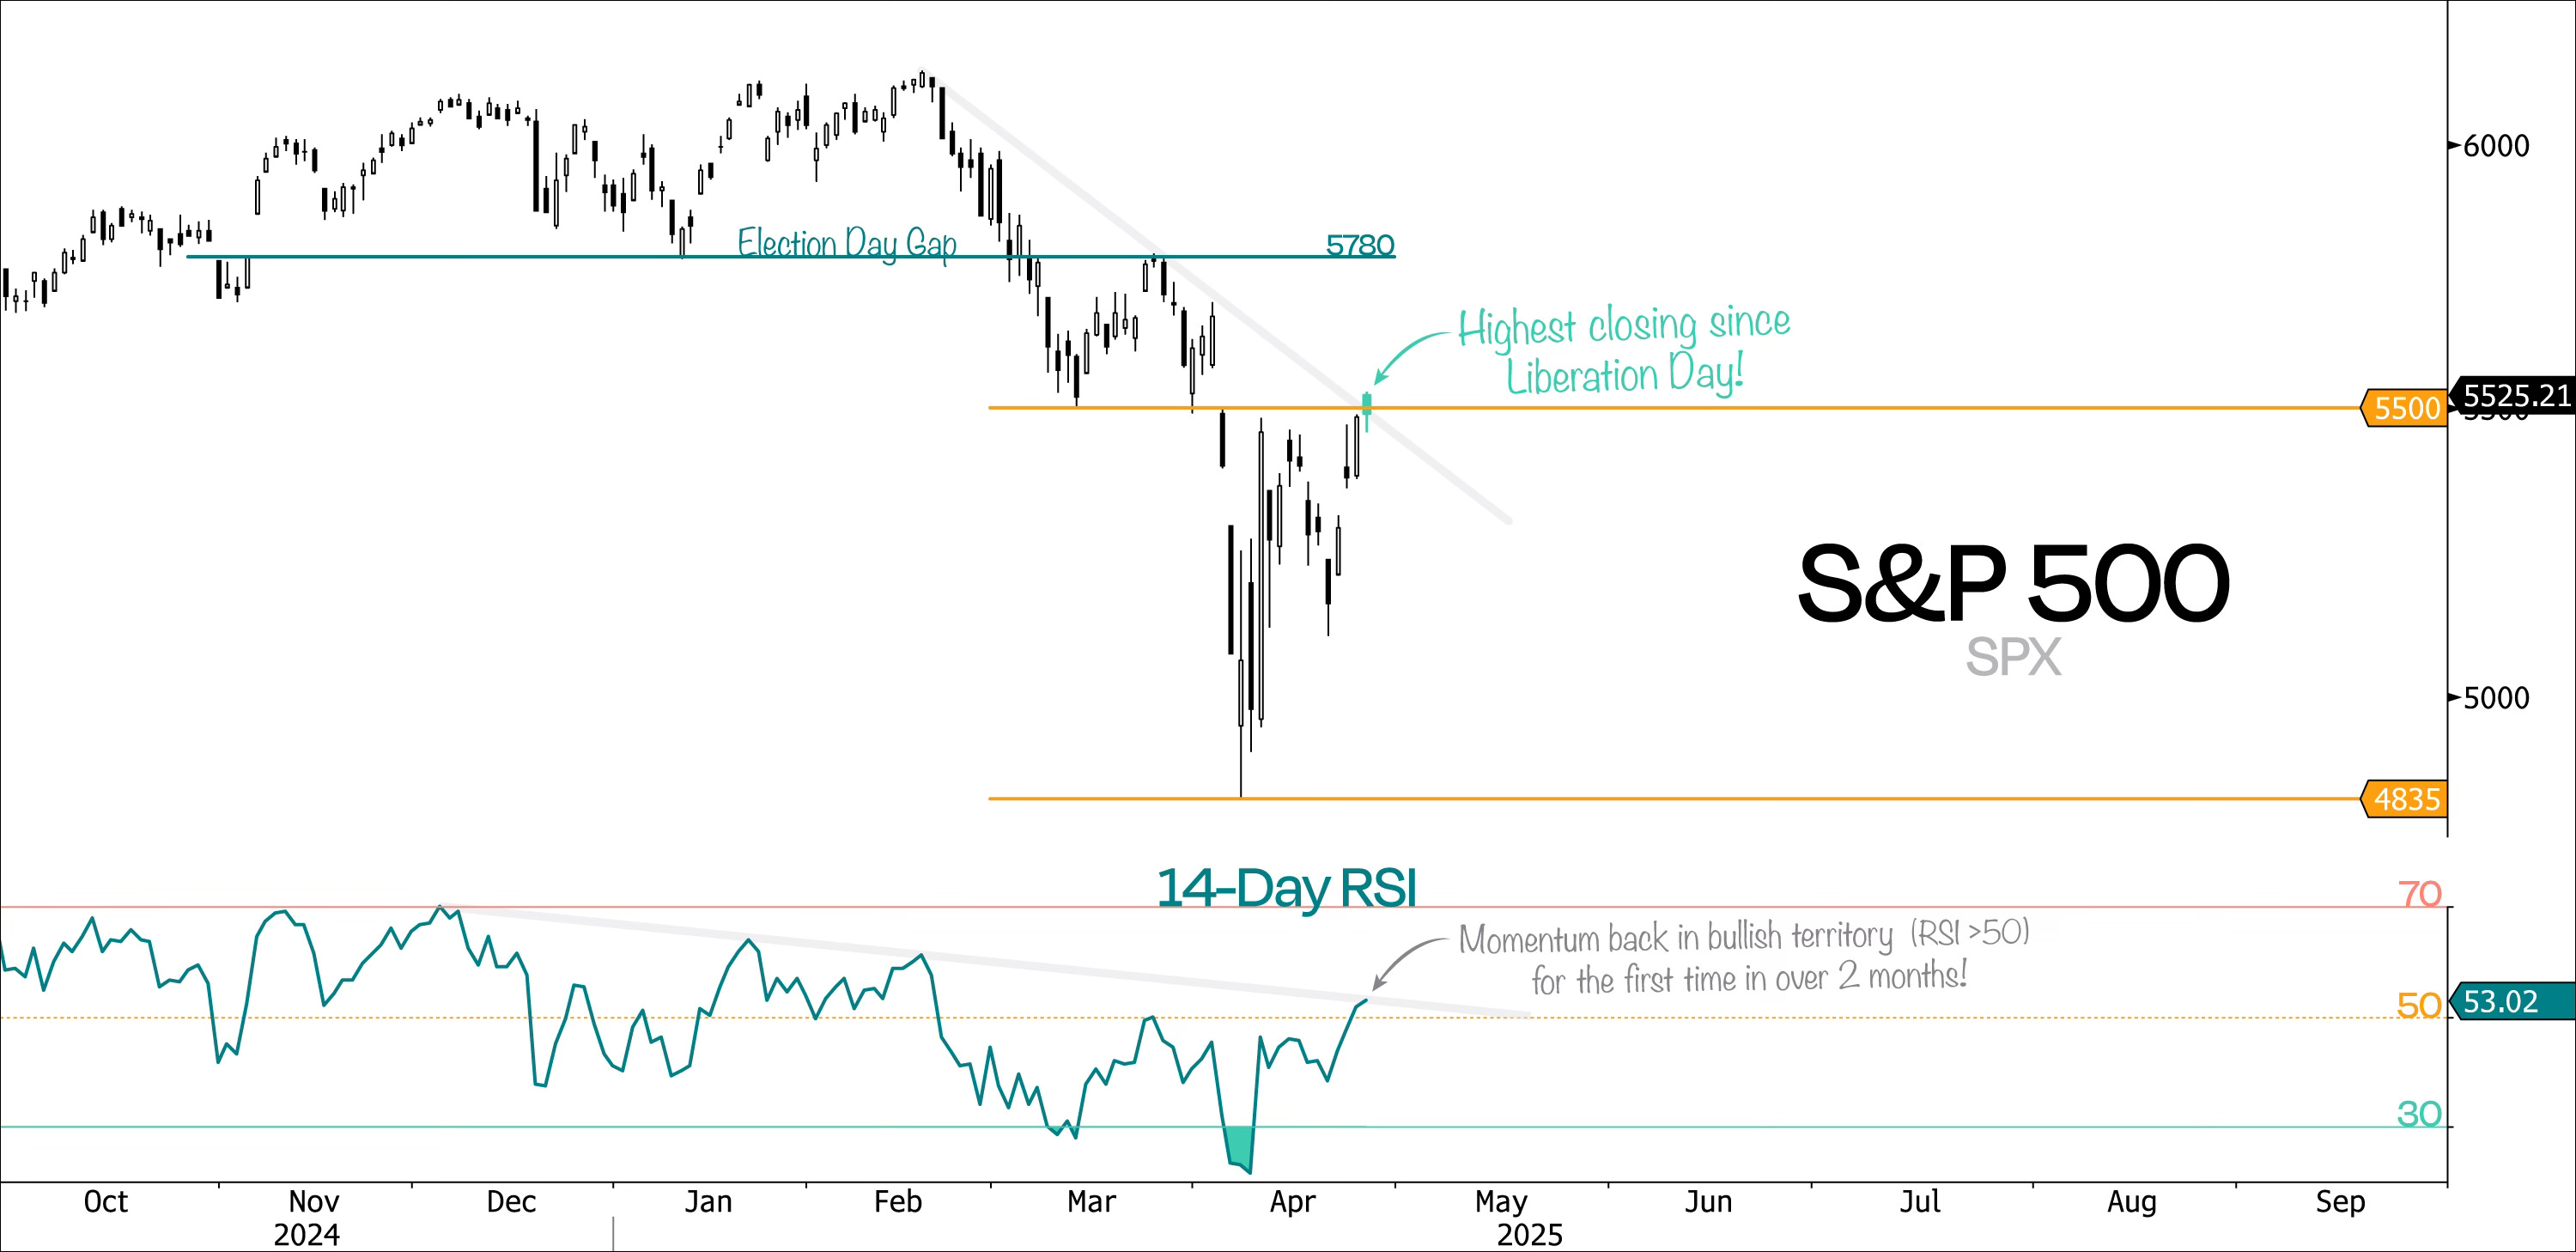
That, of course, doesn’t mean he’s going to stop throwing jabs at the situation, especially now that the S&P 500 is back at 5500, giving him a full buffer to handle any downside pain again.
But with another step lower in tariffs, we need to figure out which way to go:
Do we stick with the idea that tariffs are still too high and will cause damage at these levels?
Or do we recognize that these effective tariff rates are dropping, and the chances of this trend moving toward less tariffs, not more, are increasing every day?
We’re going with the latter! So, forget where we are today – let’s focus on where the trend is heading!
Of course, that doesn’t mean everything will bounce back immediately. Even if all tariffs magically disappear tomorrow, it doesn’t mean the economy hasn’t already absorbed some damage.
Any day now, we’re probably going to see shipping collapse headlines hit the tape – and it’ll be interesting to see if the market shrugs it off or freaks out.
After all, up until now, it has mostly been about the uncertainty around trade – not the actual damage from tariffs, which is still on the way.
That said, we shouldn’t be surprised if the S&P 500 keeps churning below the -10% correction threshold – what we last called the meat grinder range.
But what we’re really saying is that we think the 4835 low from April 7 will end up being the bottom for 2025.
And not only that, but it’s going to get harder to drift toward the lower end of the 5000-5500 range as investors stop reacting to every single headline.
Now, if that’s our view, we want to adjust our positioning to take on more risk.
But since we’re right at the scene of the crime around 5500, it makes sense to wait for a clean break above that level before cranking up exposure.
Understandably, not everyone will be comfortable with the idea of increasing risk right now. After all, trading near Liberation Day levels might feel a bit too optimistic after everything that’s gone down over the past month.
But don’t be too quick to hit the sell button if we do break above 5500. Such a move might have more legs than it seems!
In our view, clearing this level on the S&P 500 and finally leaving that meat grinder range behind marks a real shift – and it’s the kind of move that could catch a lot of investors off guard.
We’re now making a run at 5500 – and we’re doing it with the lowest VIX, strongest momentum, tightest credit spreads, and highest risk appetite in over a month.
Layer on top last week’s Zweig Breadth Thrust trigger, and it’s pretty clear we’re looking at a much more constructive technical setup.
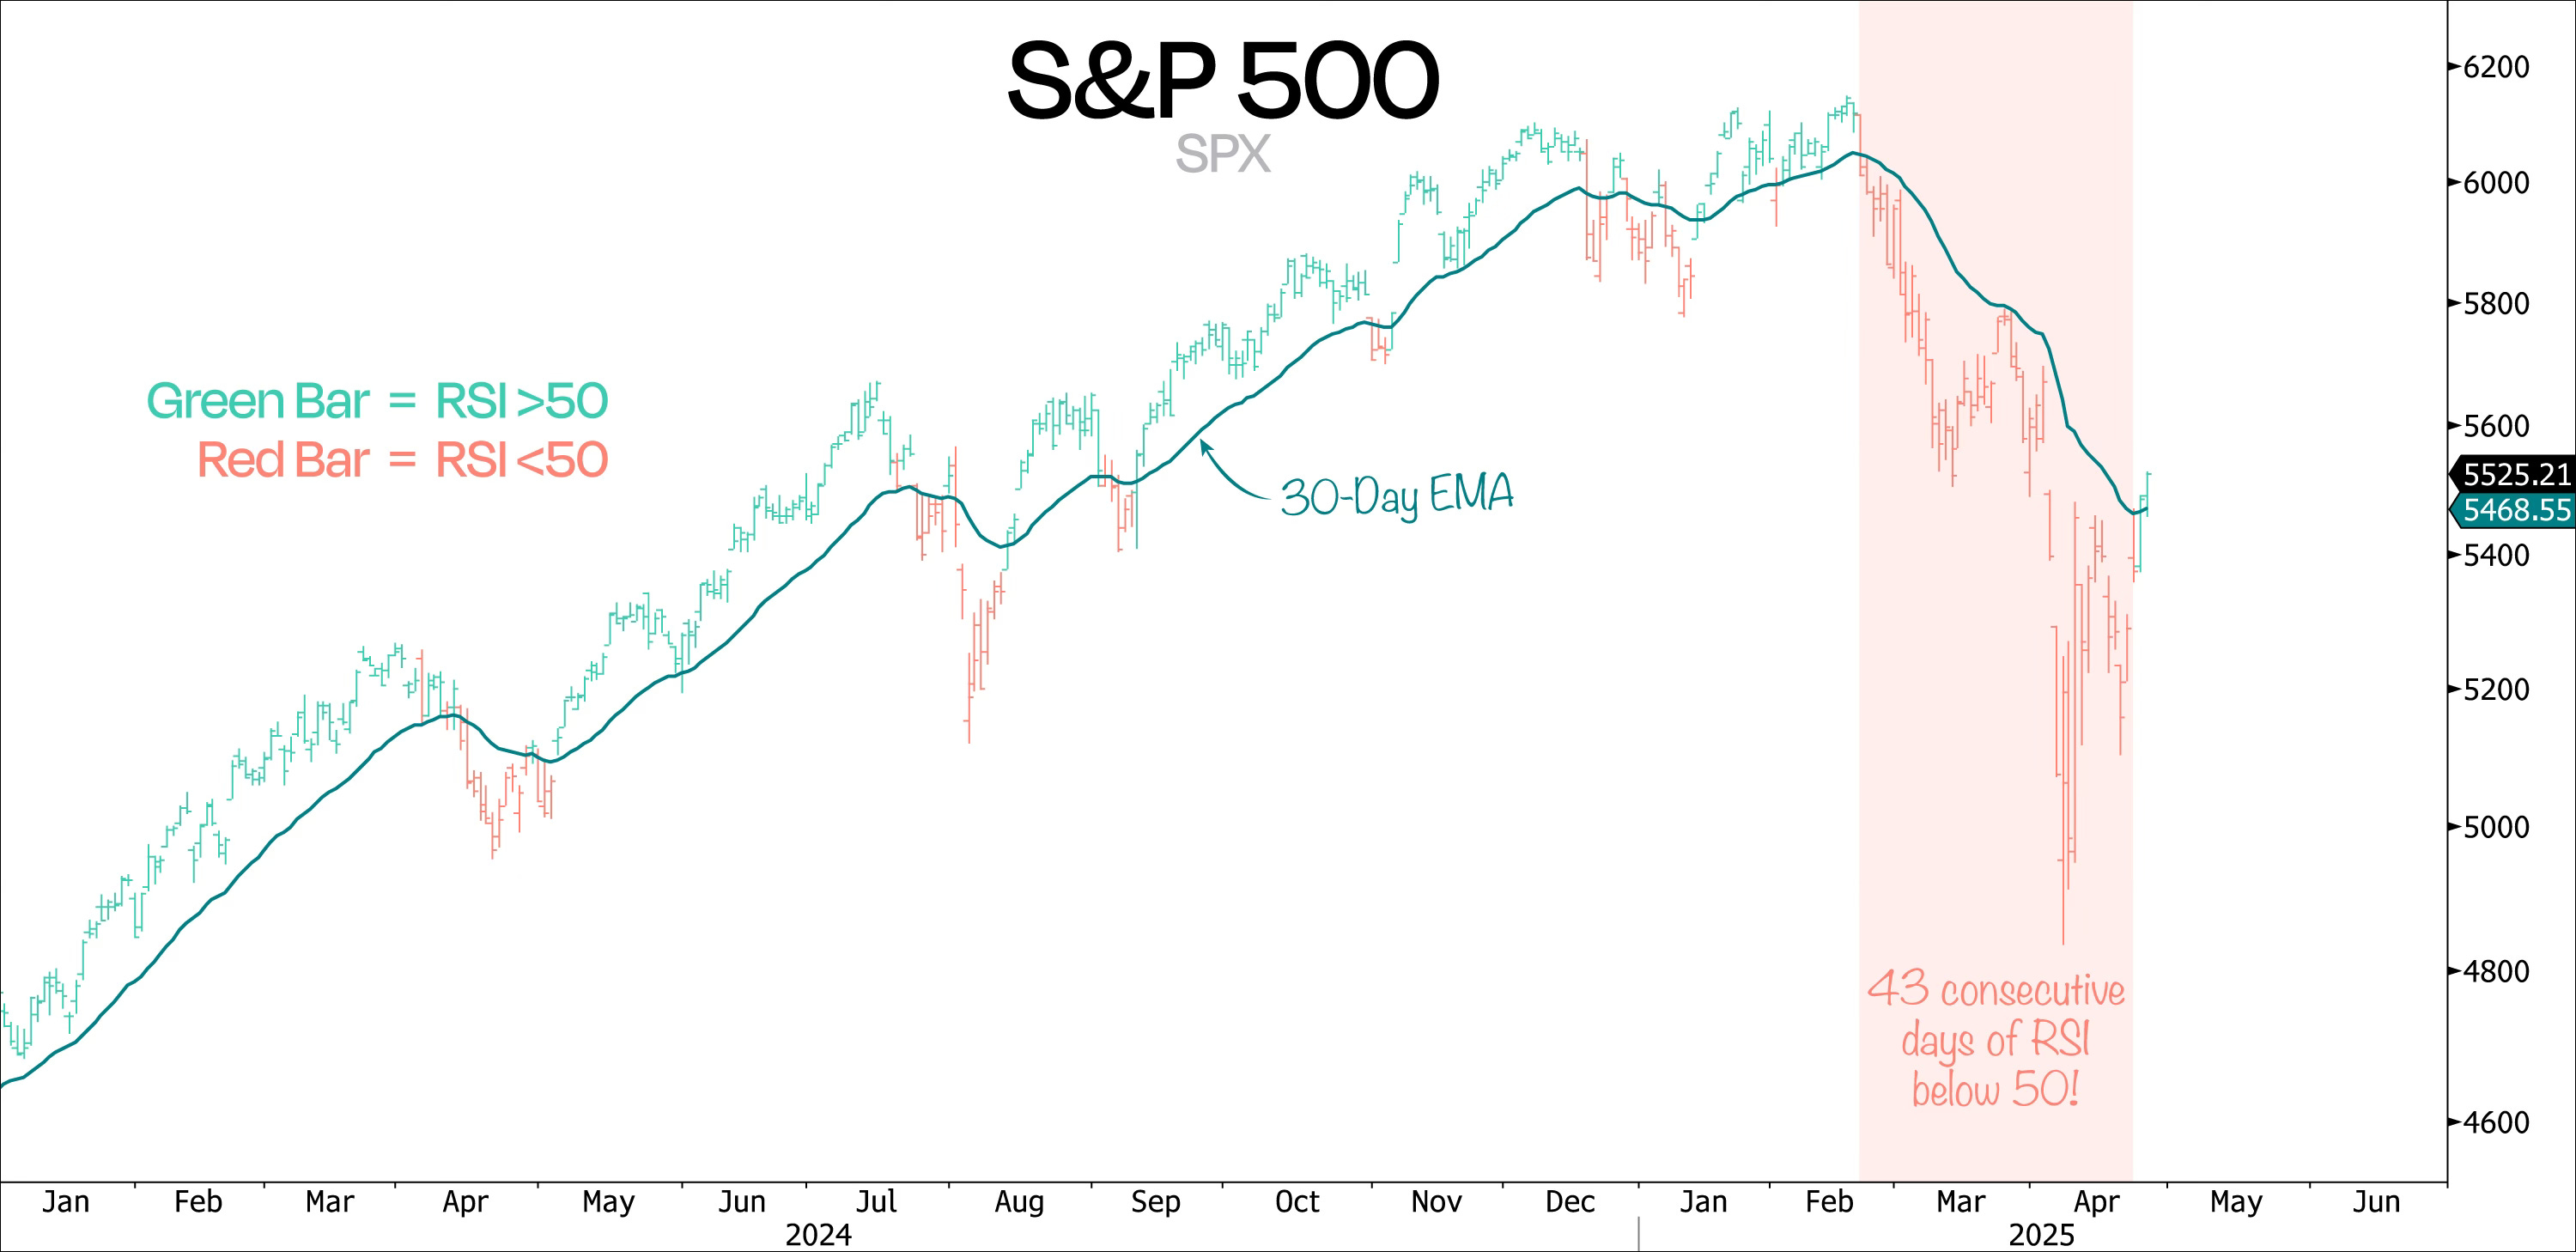
Last week’s rebound finally pushed the S&P 500 back into bullish momentum territory on the RSI after spending over 2 months (43 consecutive days) below the 50 mark – the longest streak since 2002!
In the chart below, we’ve color-coded the bars based on whether RSI is above or below 50. You’ll notice the 50 RSI mark also lines up pretty well with whether price is above or below its 30-day EMA.
In case we do clear 5500 this week, there’s a good chance we’ll soon trigger the deGraaf Breadth Thrust – our favorite of the bunch.
Historically, this indicator has preceded powerful 1-year bullish regimes. And fun fact: pretty much all of the S&P’s net gains over the past 25 years have come during those regimes.
That on its own would be solid technical confirmation that the bottom is in and a real trend shift could be just around the corner – especially with sentiment already having collapsed.
Now, the best part is that positioning is still super light. Big funds dumped risk in the sell-off and never came back.
According to Goldman, US Long/Short net leverage remains near 5-year lows. And according to the NAAIM Exposure Index, active managers have barely touched this rally, even reducing exposure further after the 3rd-best single-day gain since 1950.
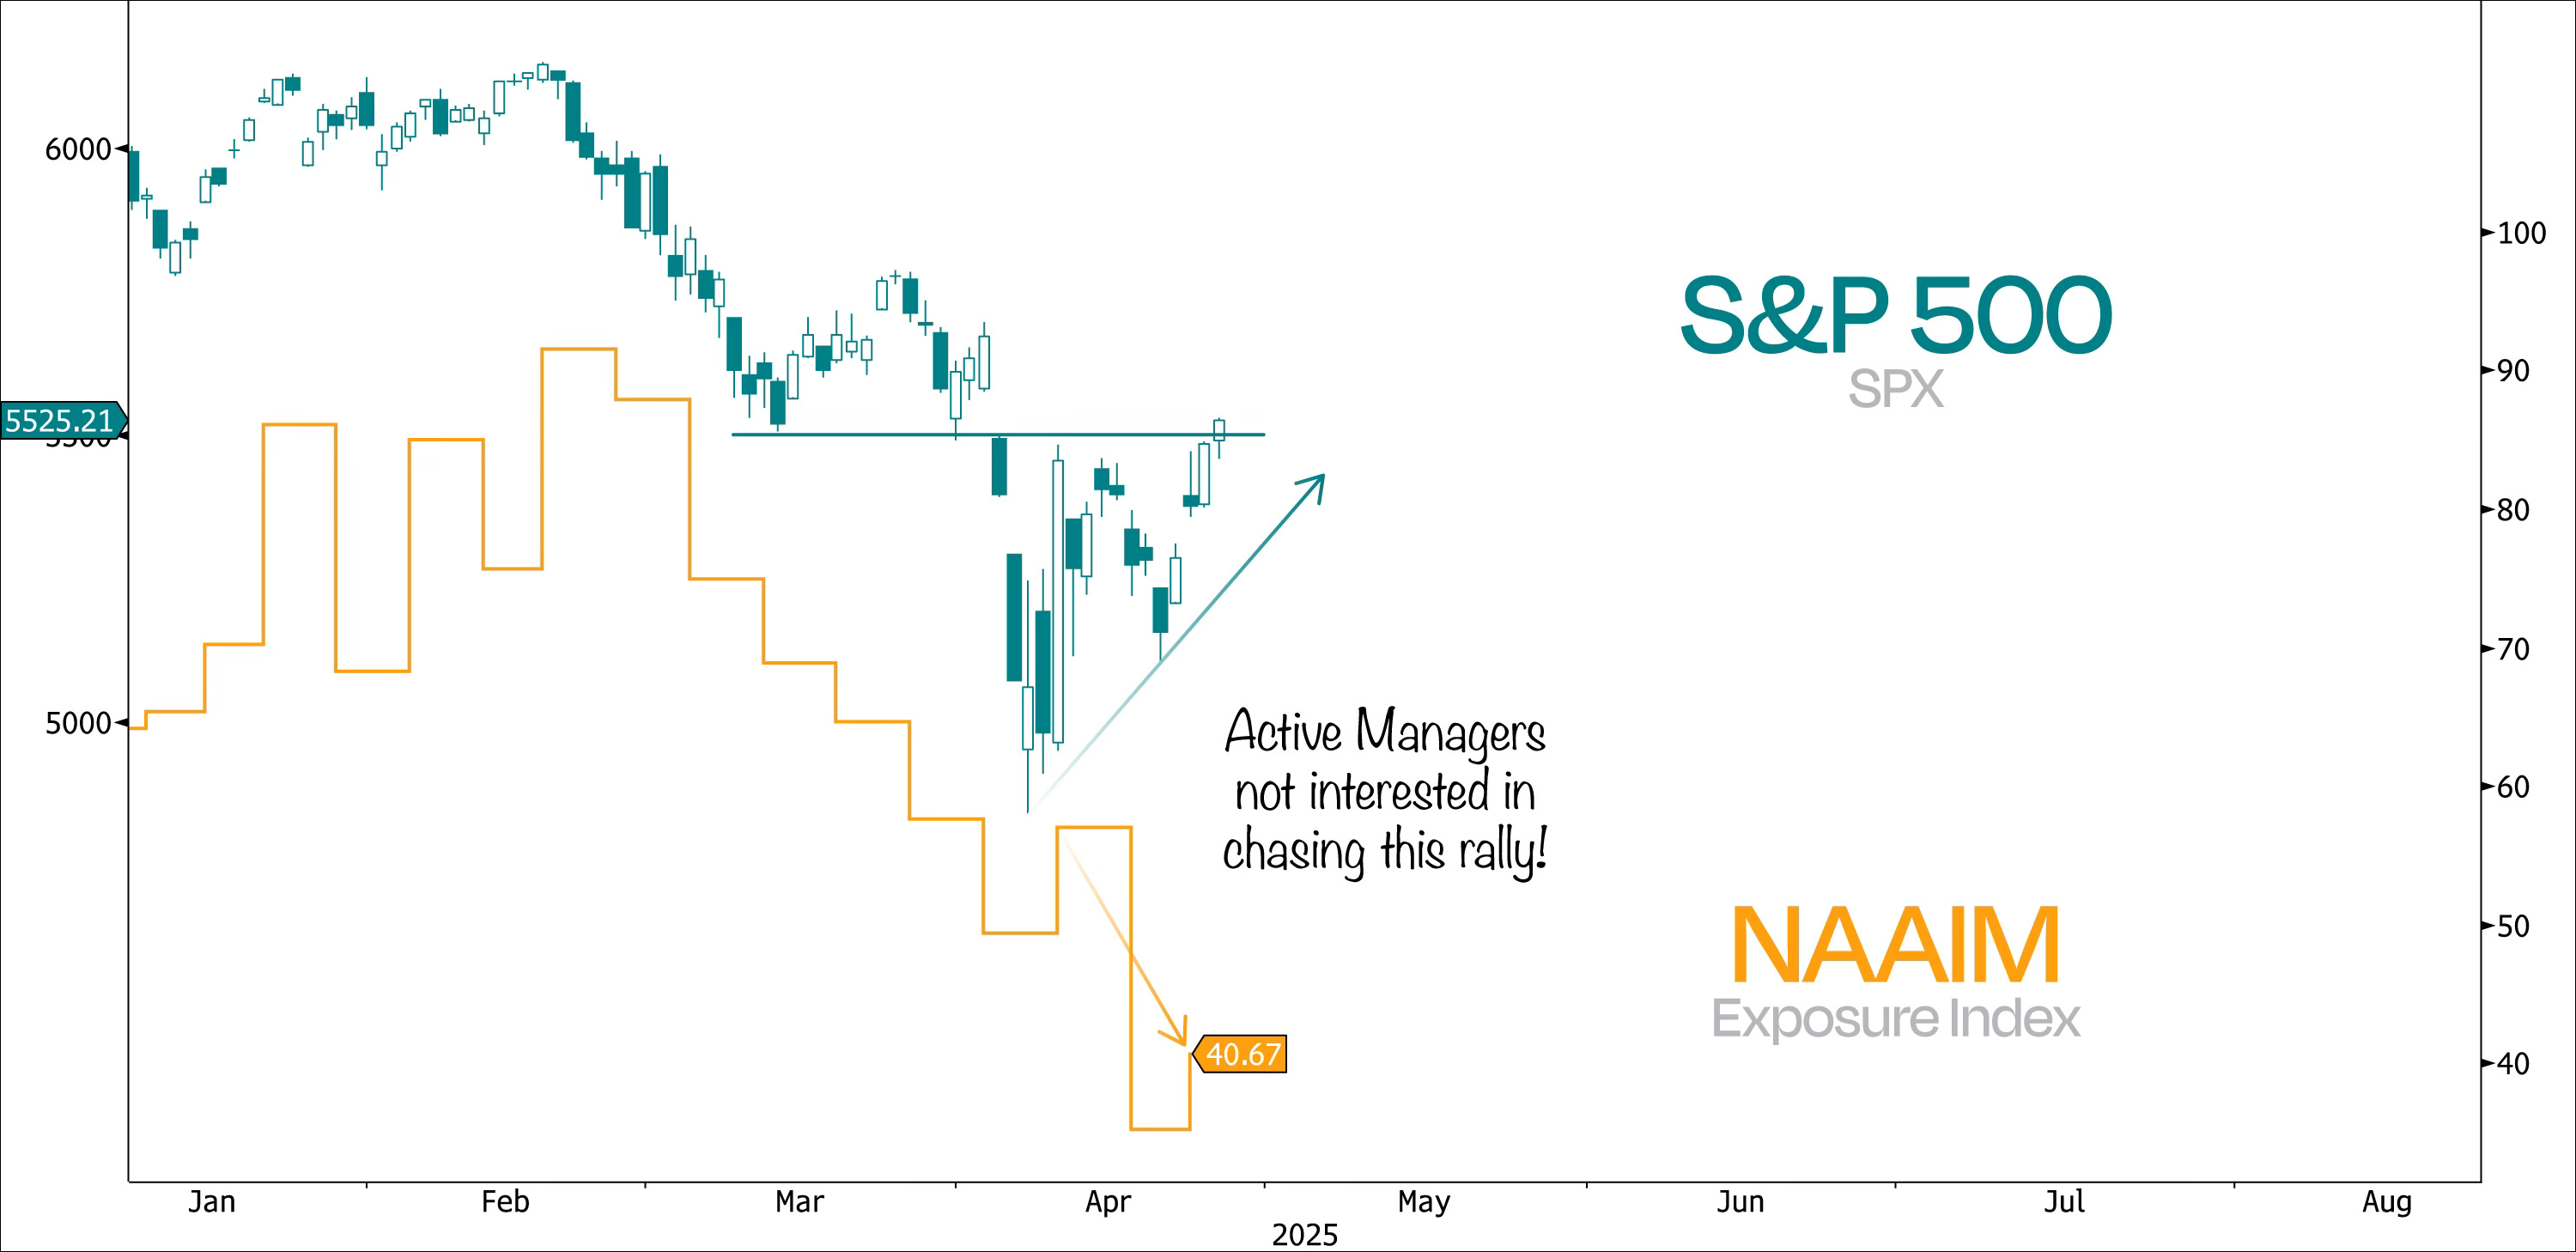
Looking at this, they better hope this rally doesn’t keep rolling, or they’re going to have to chase it. Hard.
Bottom line: this doesn’t look like a rally to fade – it looks like one that could feed on itself.
So, where does that leave us?
Well, look, a few weeks back, we said we weren’t ready to throw in the towel on this bull market that kicked off in October 2022.
Sure, Trump drove a knife into this bull market, but thankfully, our fears about him twisting it haven’t (at least not yet) played out.
But as always, calling the bottom is tough because fear is a powerful emotion. That’s why fear buying goes against our natural survival instincts, while fear selling feels much more natural.
The fact is, 5500 on the S&P 500 looms large.
If we get some follow-through, it’ll be yet another reminder that price moves first, and the stories come after.
Now let’s see if the market confirms.
If not, go hit the golf course and enjoy the day – there’s nothing to see here below 5500.