

Another week, another win for the bulls.
The S&P 500 finished the week up more than 5%, with the index rising every single day – a move you definitely don’t see in bear markets.
Most major indexes are now back above their 200-DMAs, and the NYSE advance-decline line just hit fresh all-time highs.
Optimism is creeping back into the market, yet positioning remains crazy bearish.
That creates fuel – not friction – for further gains.
After all, we need bulls to have a bull market, and the less they own, the more they need to chase.
Meanwhile, trade deals look set to flood the headlines, but investors already seem to be shifting their focus away from tariffs and toward the more growth-friendly parts of the President’s agenda.
We’re going to go out on a limb and say the jury has spoken:
This bull market didn’t die – it reloaded!
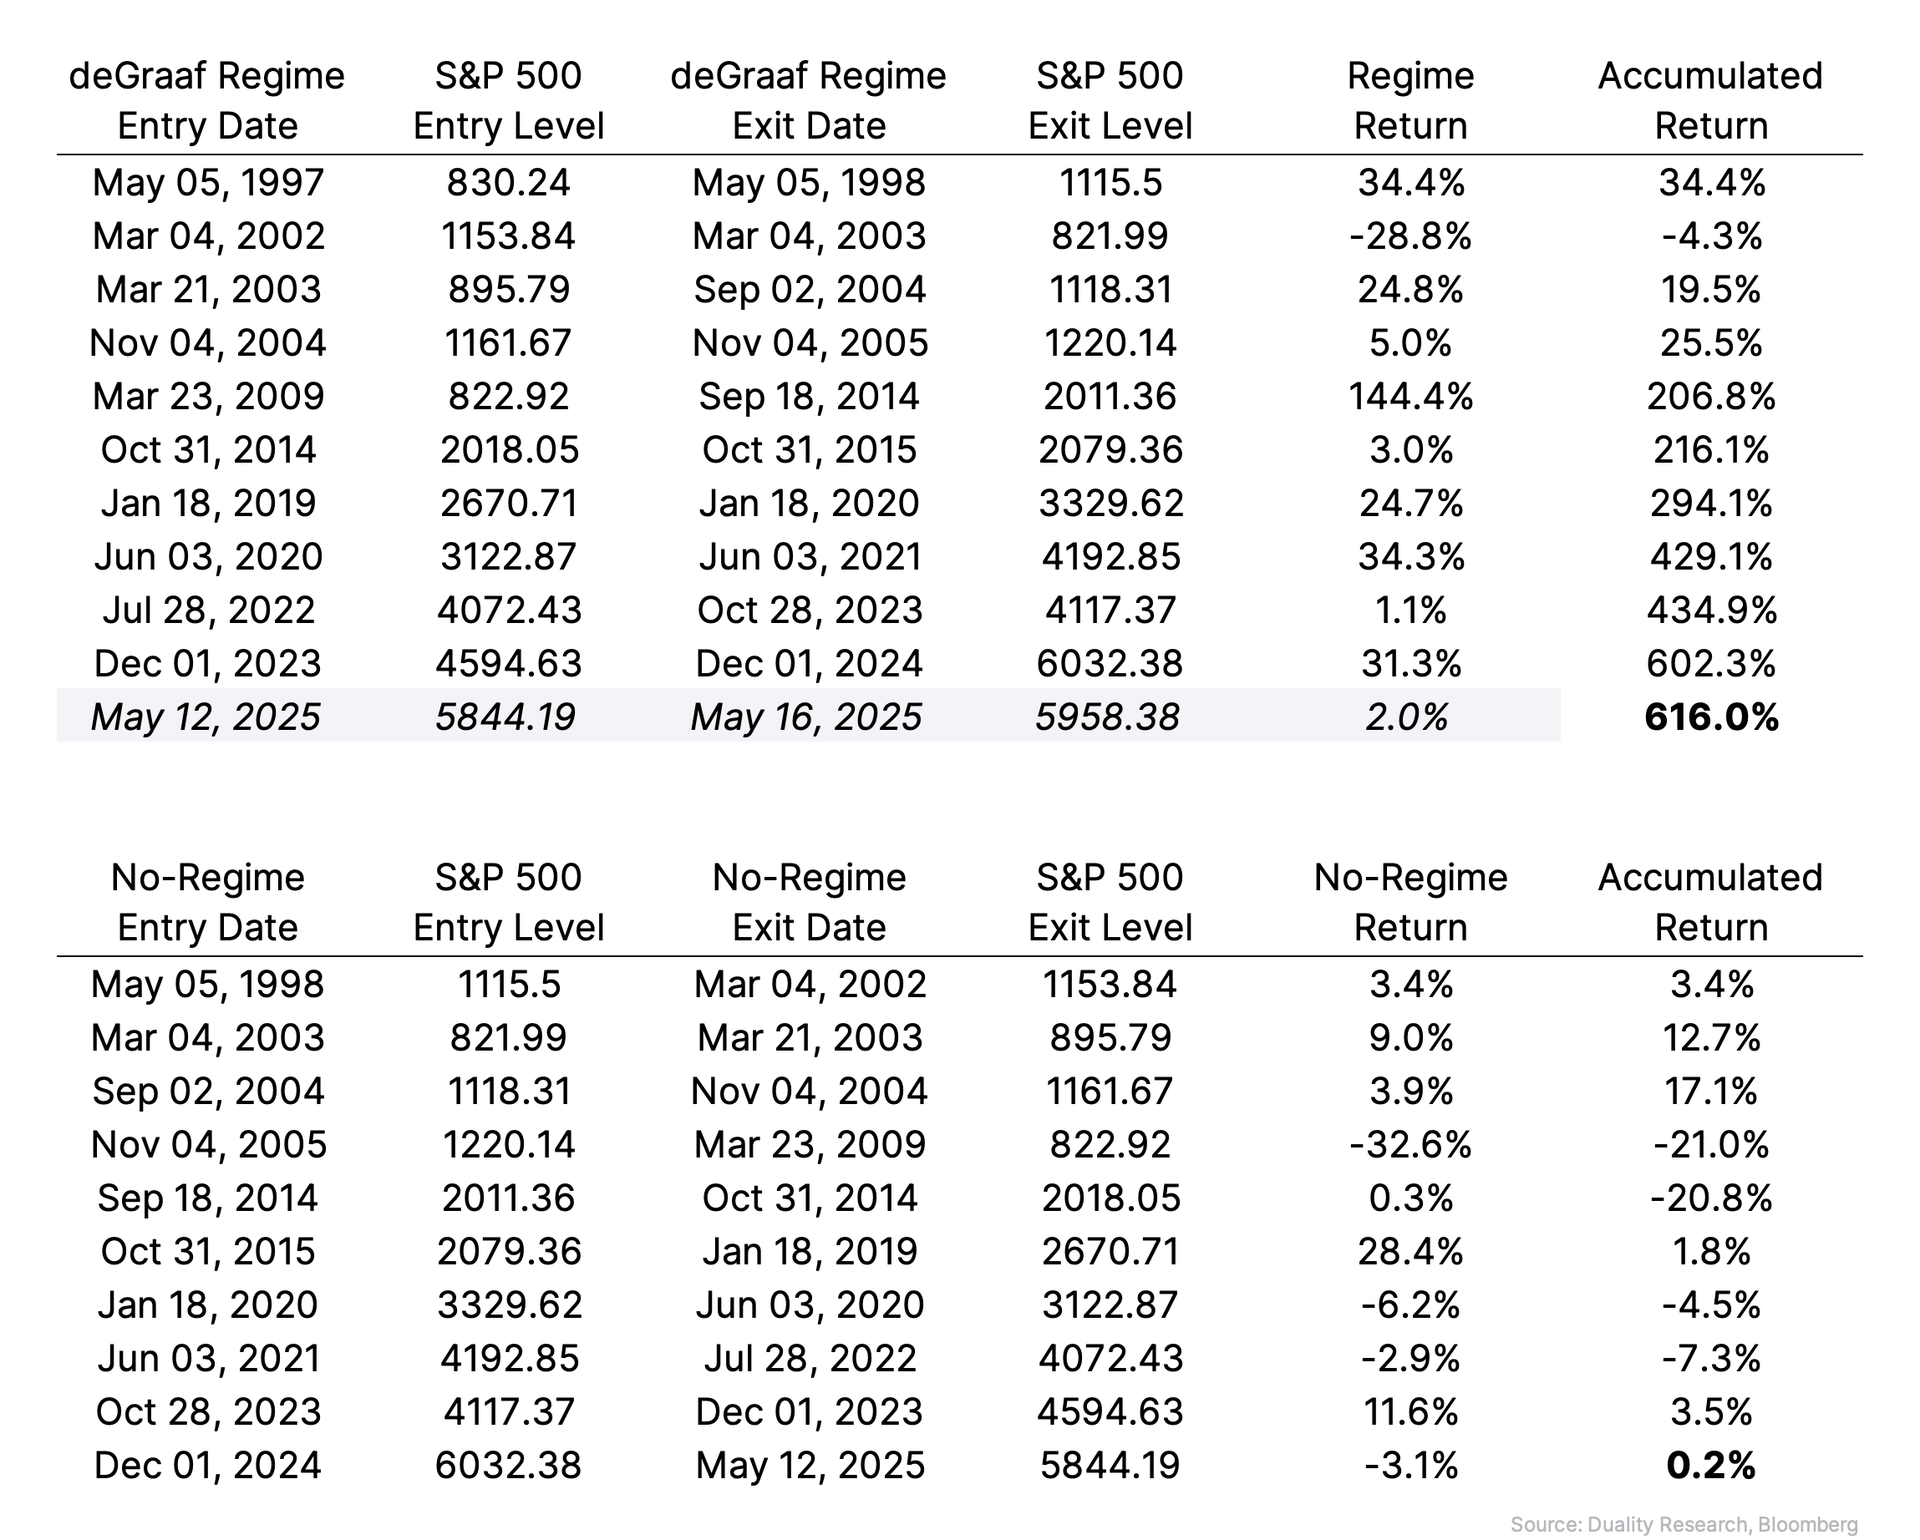
What’s giving us real confidence is a rare and powerful signal that flashed last Monday – a deGraaf Breadth Thrust.
3 weeks ago, we flagged that conditions were lining up for this to occur, which by itself is a strong sign the bottom is in.
Fast forward 2 weeks, and we got confirmation!
By now, you’ve probably lost track of all the breadth indicators that have been flashing buy signals recently.
But honestly, this one’s the most important – and the only one you really need to watch – because it signals the start of a new bullish regime lasting 1 year.
A deGraaf Breadth Thrust is triggered when 55% or more of S&P 500 stocks close at new 20-day highs.
And when that happens? The results speak for themselves.
Since 1975, we’ve seen 30 of these signals (excluding repeats within 21 days).
One year later, 29 of those instances showed positive returns, with a median gain of +16%.
Now, we know what you’re thinking: chances are you’ve seen way better stats floating around lately, all saying the market’s up big a year after something like this happens.
But unlike most of them, the deGraaf Thrust fires off regularly and nails nearly every big wave of money flowing into the market – the kind that kicks off new bullish regimes.
Just take a look at our first chart: every major thrust since 1975 laid the groundwork for a meaningful advance.

As you can see, the shaded areas marking breadth thrust regimes were clearly times you wanted to be long stocks.
But here’s the wild part: since 1997, literally all of the S&P 500’s net gains have come during such regimes.
And here’s what’s crazy: that’s 28 years of data, but only about 15 of those years were spent in thrust regimes.
Let that sink in – and think about how much better your golf game could be.
That’s why this is our favorite breadth thrust indicator. It’s reliable, it’s powerful, and it’s something you definitely want in your toolkit.
Now, to really kick things up a notch, we’re looking to see which of these regimes line up with the rare – and more powerful – Zweig Breadth Thrust.
After all, both signals just triggered recently.
Thankfully, our friend ran the numbers and discovered that whenever the deGraaf and Zweig Breadth Thrust occur within a month of each other, the average 12-month gain jumps to +26%, and higher every time.
Only happened 7 times in history, though. So yeah – it’s rare. But when it shows up, it matters!

When we consider that sentiment is still fairly weak (though improving) and positioning remains extremely bearish, the takeaway is clear: historically, these conditions have led to above-average returns over the next 12 months.
Now, it’s no secret that the market has been firing on all cylinders lately, so we’re likely due for some consolidation – or maybe even a pullback.
But really, the burden is to be bullish here and to make sure that you’re having exposure, given the historical precedence of this momentum.