
Bad Forecast, Clear Skies
Thoughts on the Market

We can summarize last week by highlighting that the S&P 500 ended lower.
Or, we could look at it this way:
Tariff de-escalation is still moving in the right direction.
Investment-grade credit spreads finally dropped below 100bps – the lowest since April 2.
And risk appetite is picking up, with Discretionary beating Staples and High Beta outperforming Low Volatility.
Ultimately, it’s a matter of perspective – the choice is yours.
For us, the glass remains half full.
But let’s be real, with this being one of the most hated rallies we’ve ever seen, it’s clear to us that for most investors it still feels half empty.
And that’s great!
We hope to see a healthy level of scepticism.
We want to see more people saying, “This makes no sense.”
We need to see investors selling too early, only to end up chasing it higher.
And guess what, we’re seeing it:
Goldman Sachs: “markets might not have bottomed”
Wells Fargo: “could retest the lows”
Morgan Stanley: “retesting the low end of 5,000 range is feasible”
JP Morgan: “sees S&P 500 falling to 4,000 in worst case scenario”
Bank of America: “sell the rebound in US stocks”
Denial and confusion, officially in vogue!
While our take is certainly contrarian, it’s not about being contrarian just for the sake of it.
This is about seeing the setup: everything lining up for a major upside move while most people are too scared to see it.
On one hand, global liquidity is expanding rapidly.
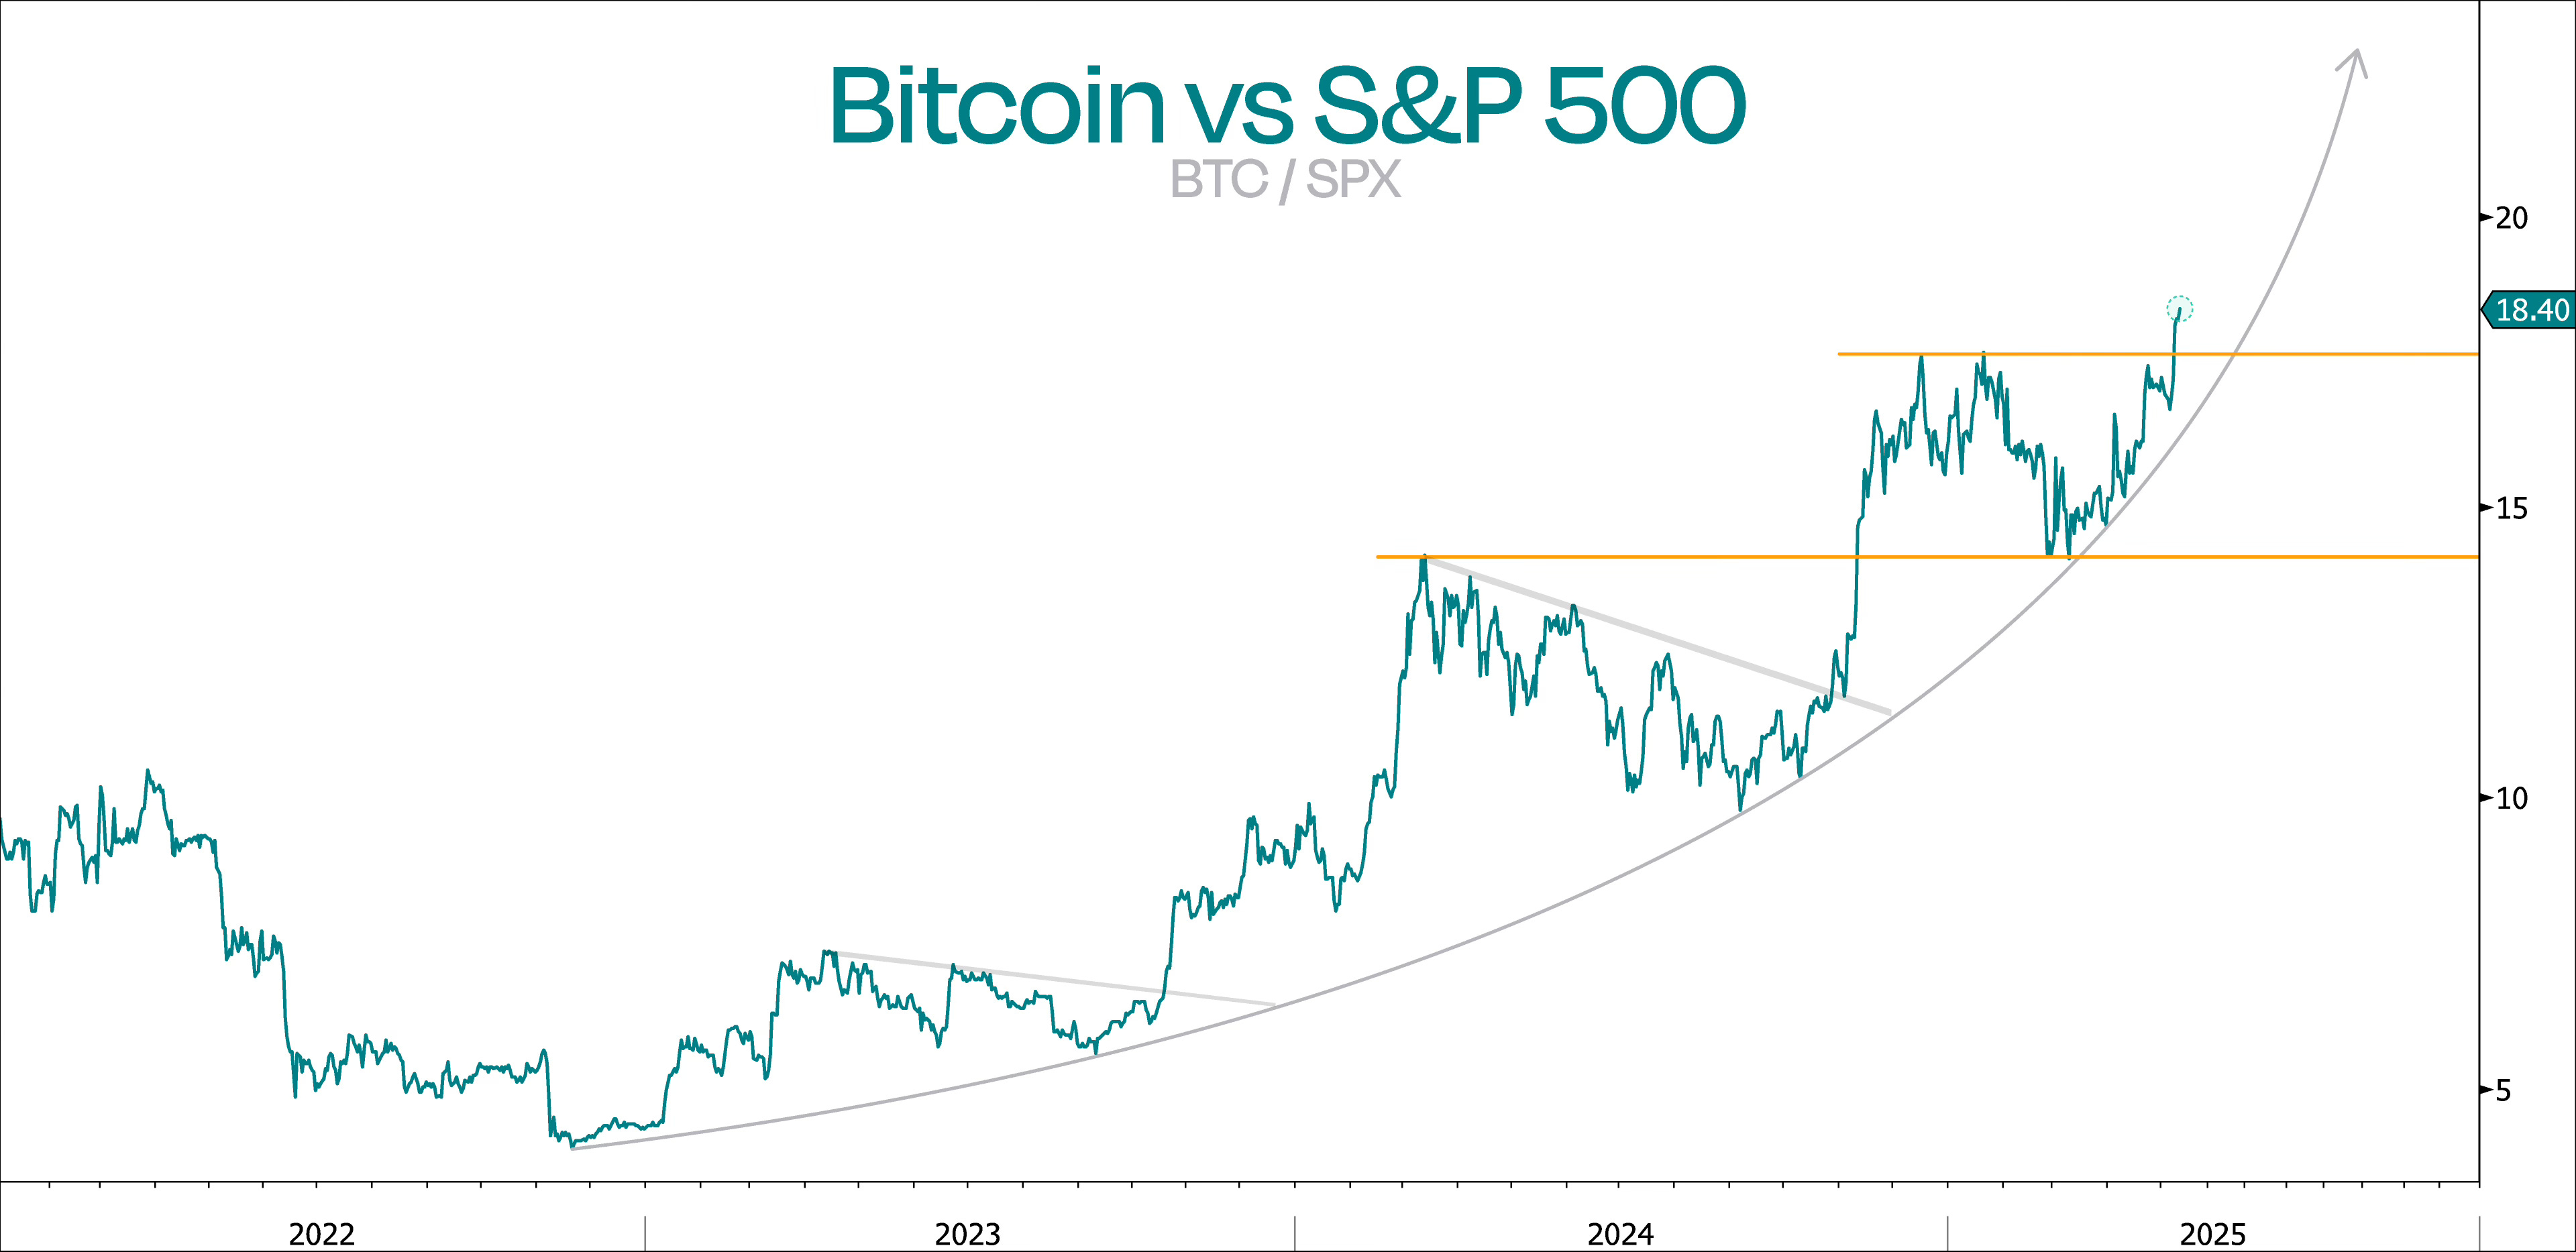
Just look at Bitcoin – it’s breaking out to new relative all-time highs against the S&P 500. As the ultimate risk-on asset, its strength is signaling a bullish outlook for risk assets across the board.
On the other hand, hedge funds and big institutions are badly positioned.
Put it all together, and you’ve got the perfect recipe for this rally to not only continue, but potentially accelerate.
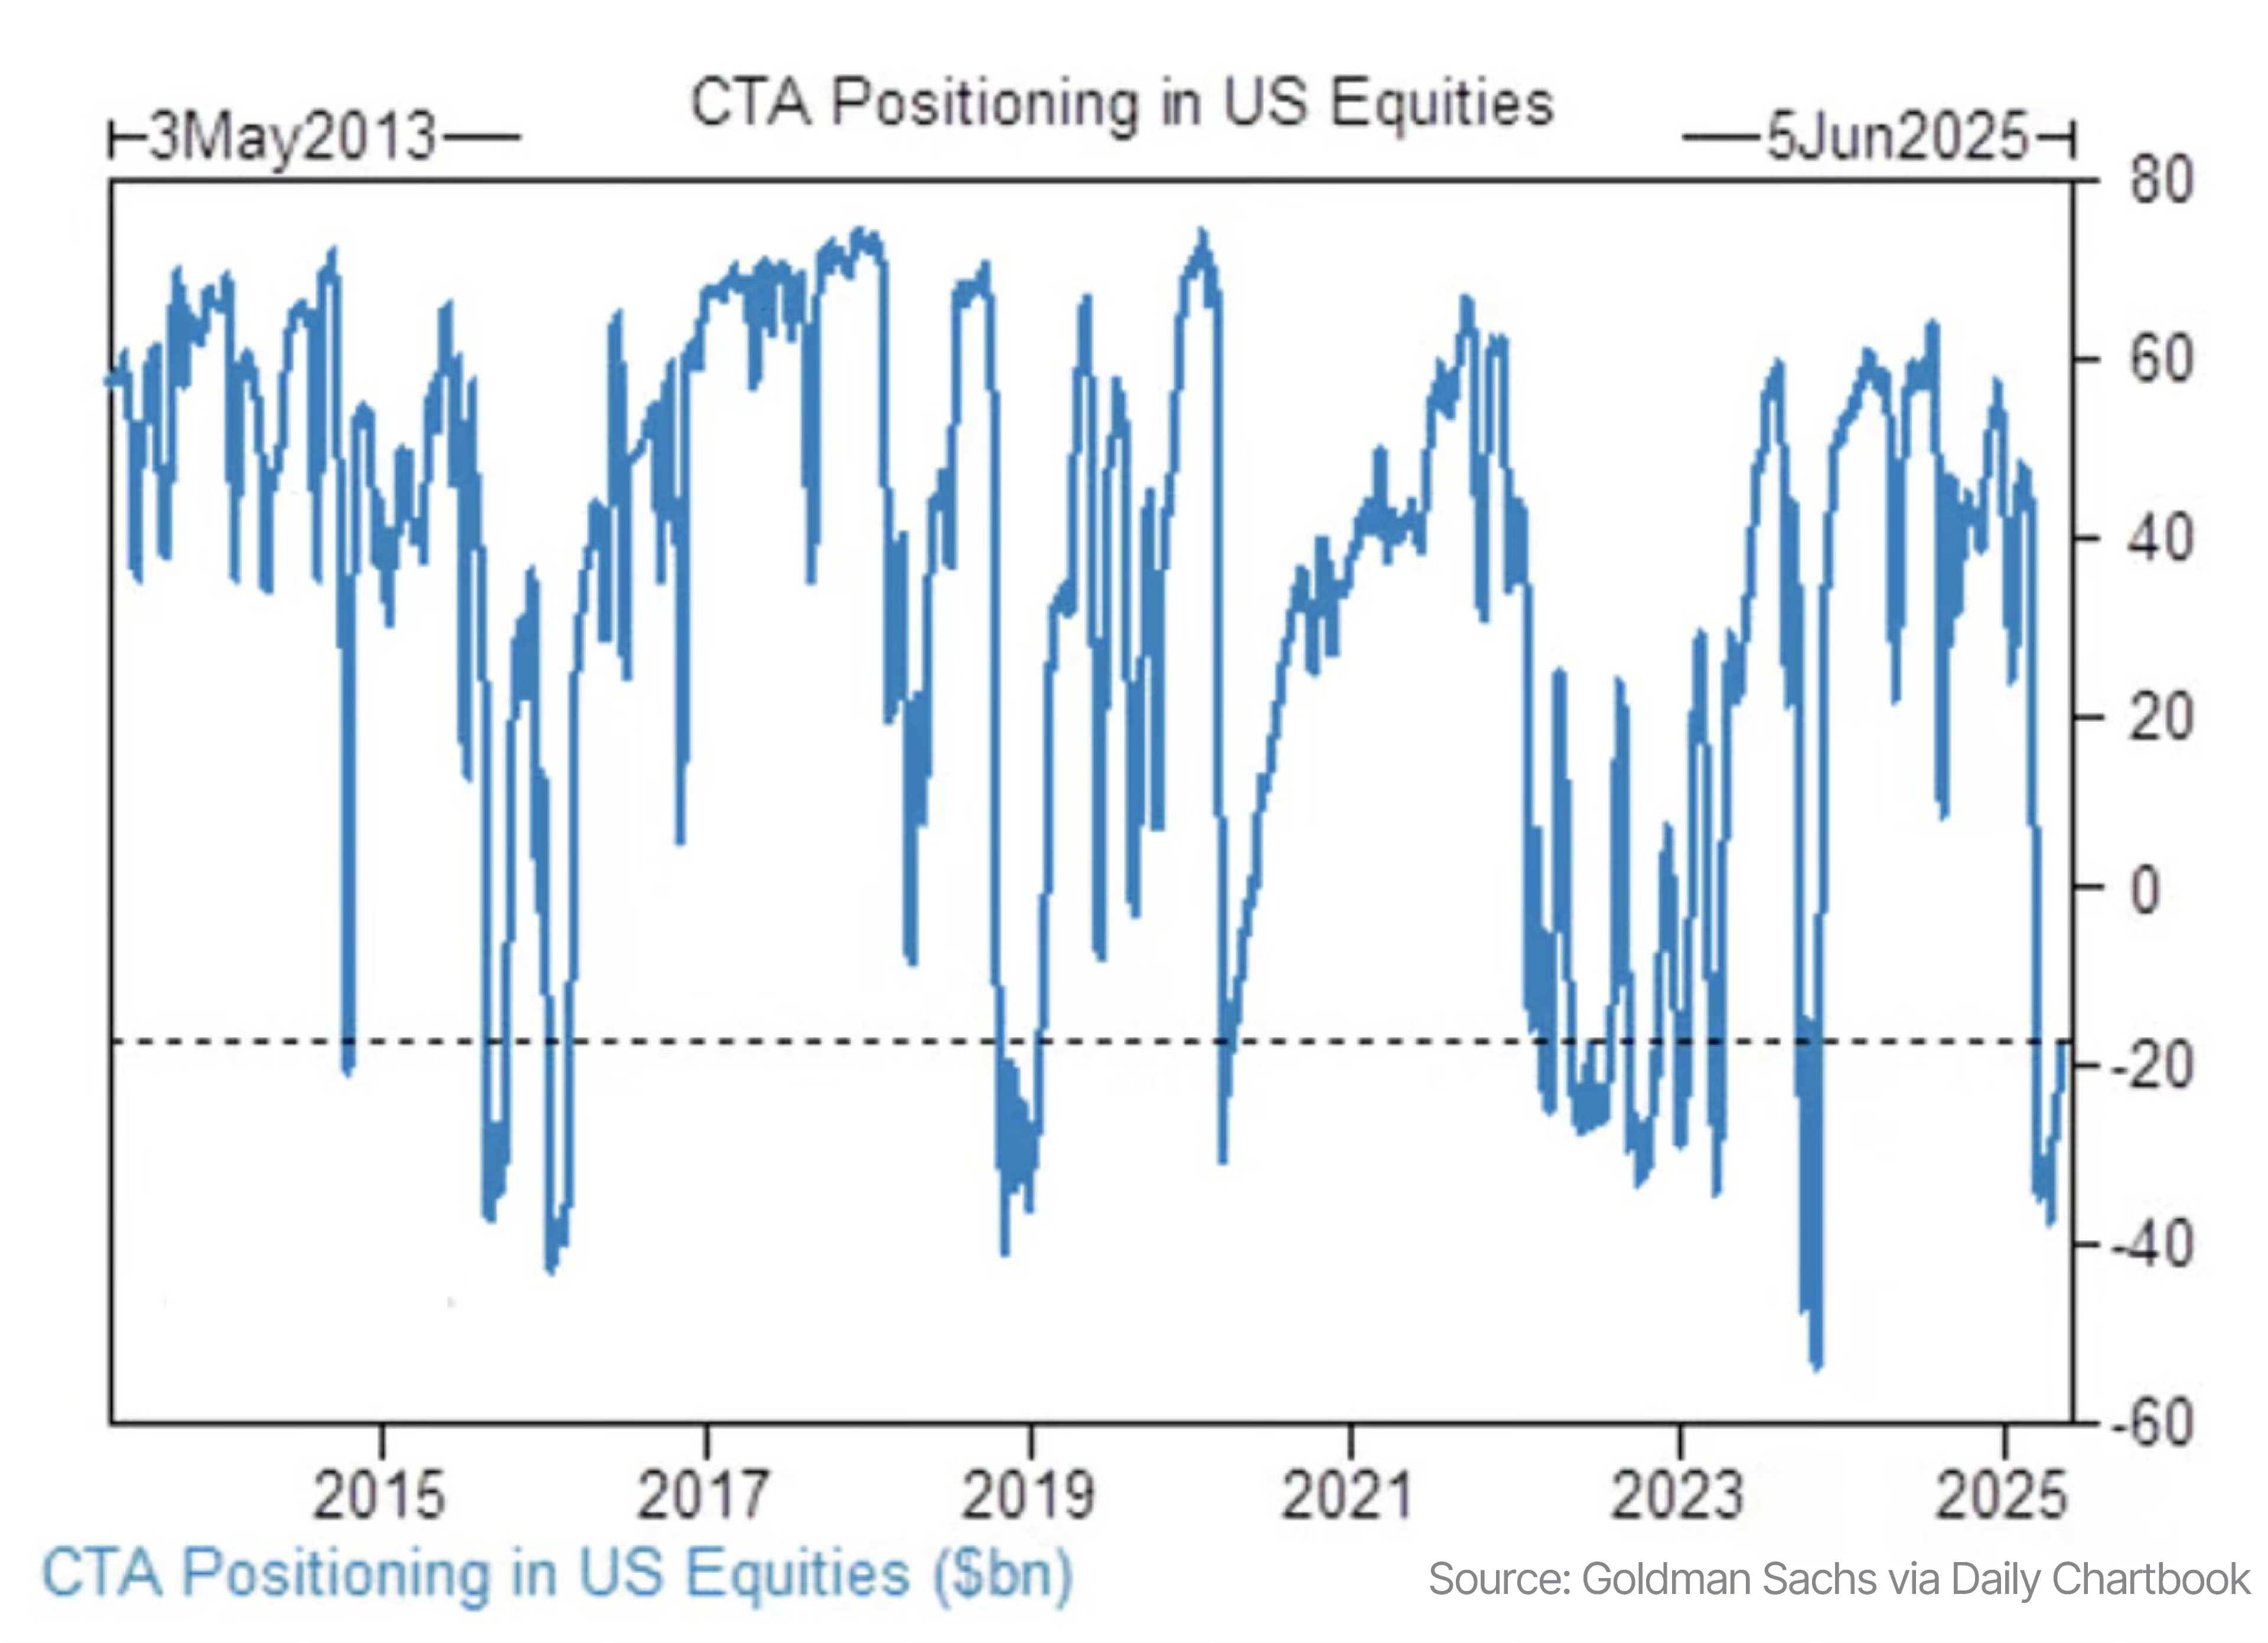
CTA positioning in US equities remains extremely light – mostly short, though they’ve moved off the absolute lows a bit.
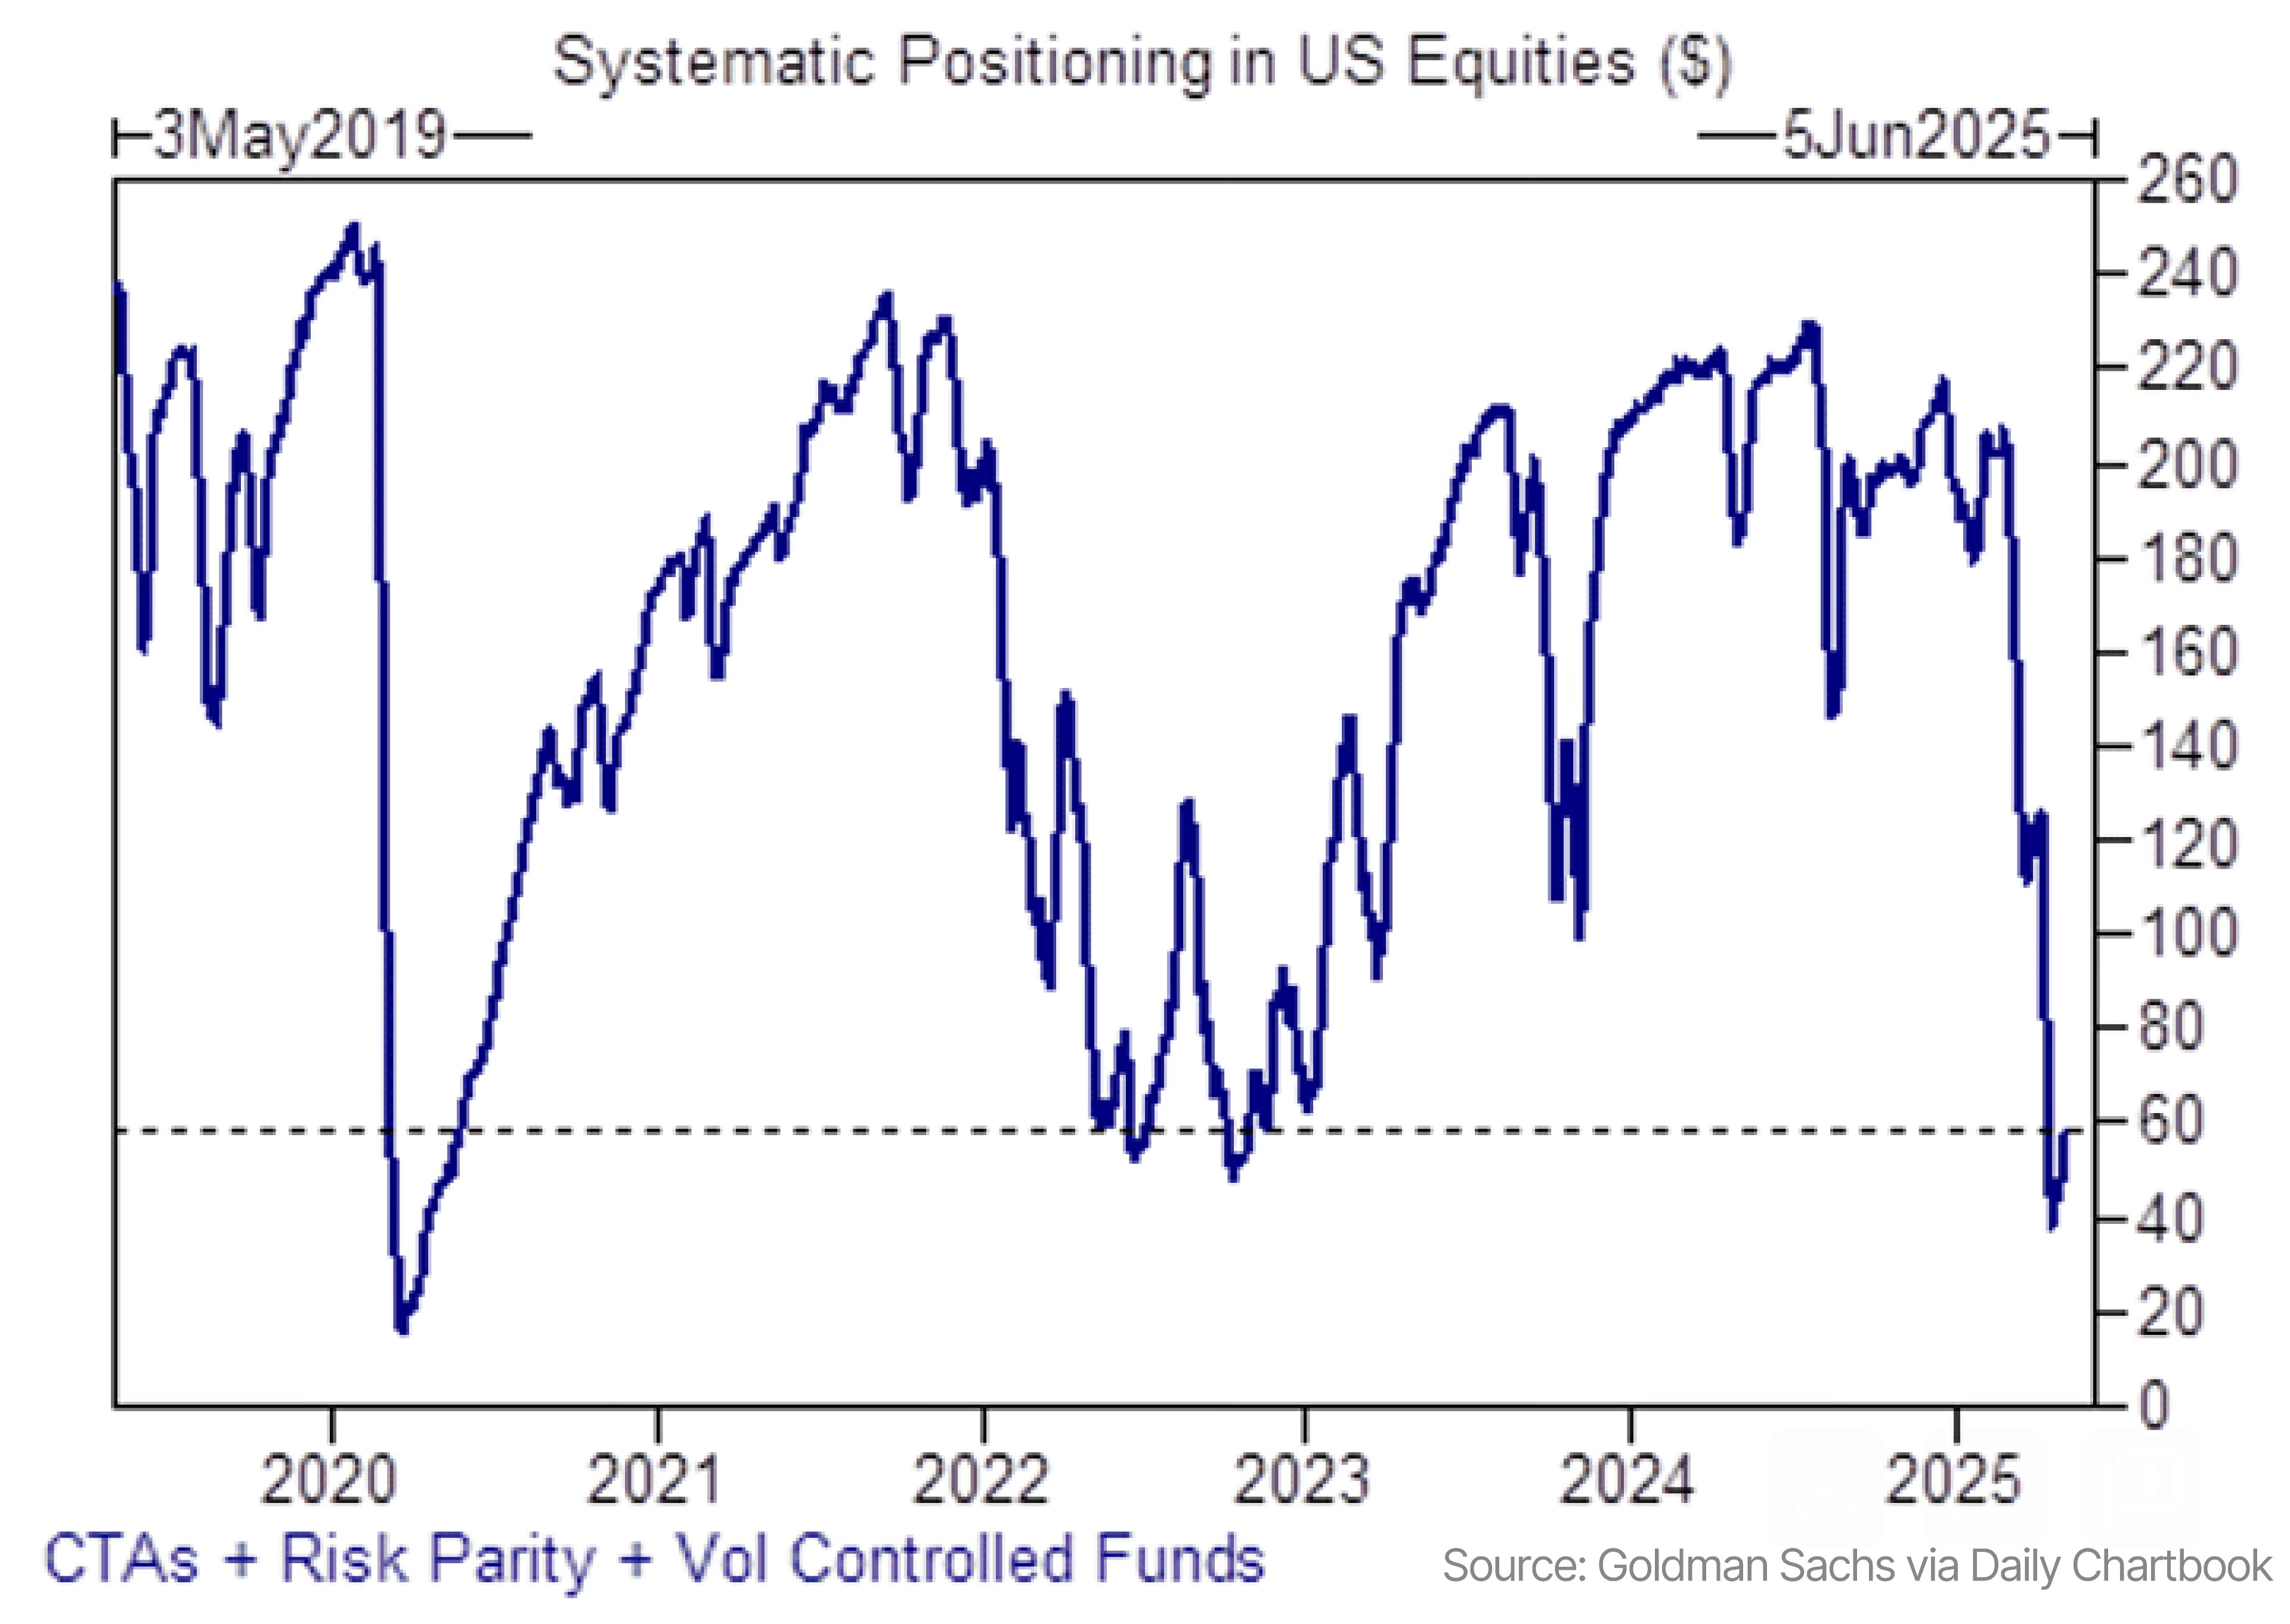
Looking at broader systematic positioning, including risk parity and volatility-controlled funds, we can also see a small uptick, but these positions are still nowhere near pre-crash levels.
This means there’s substantial upside potential for this rally that no one’s expecting.
We could further point out that US equity mutual funds and ETFs saw over $10 billion in redemptions during the last week of April, or that hedge fund and institutional clients at Bank of America are still heavy sellers.
But you get the point – nobody’s positioned, yet risk assets are already on the move up.
Clearly, this is shaping up to be one of the most exciting setups in years!
Now, whenever we’ve got a setup this strong, it’s still important to have a backup plan in case things go south.
Any slowdown in tariff talks could lead to a quick drop, especially now that we’ve learned the Fed’s strategy is to be late.
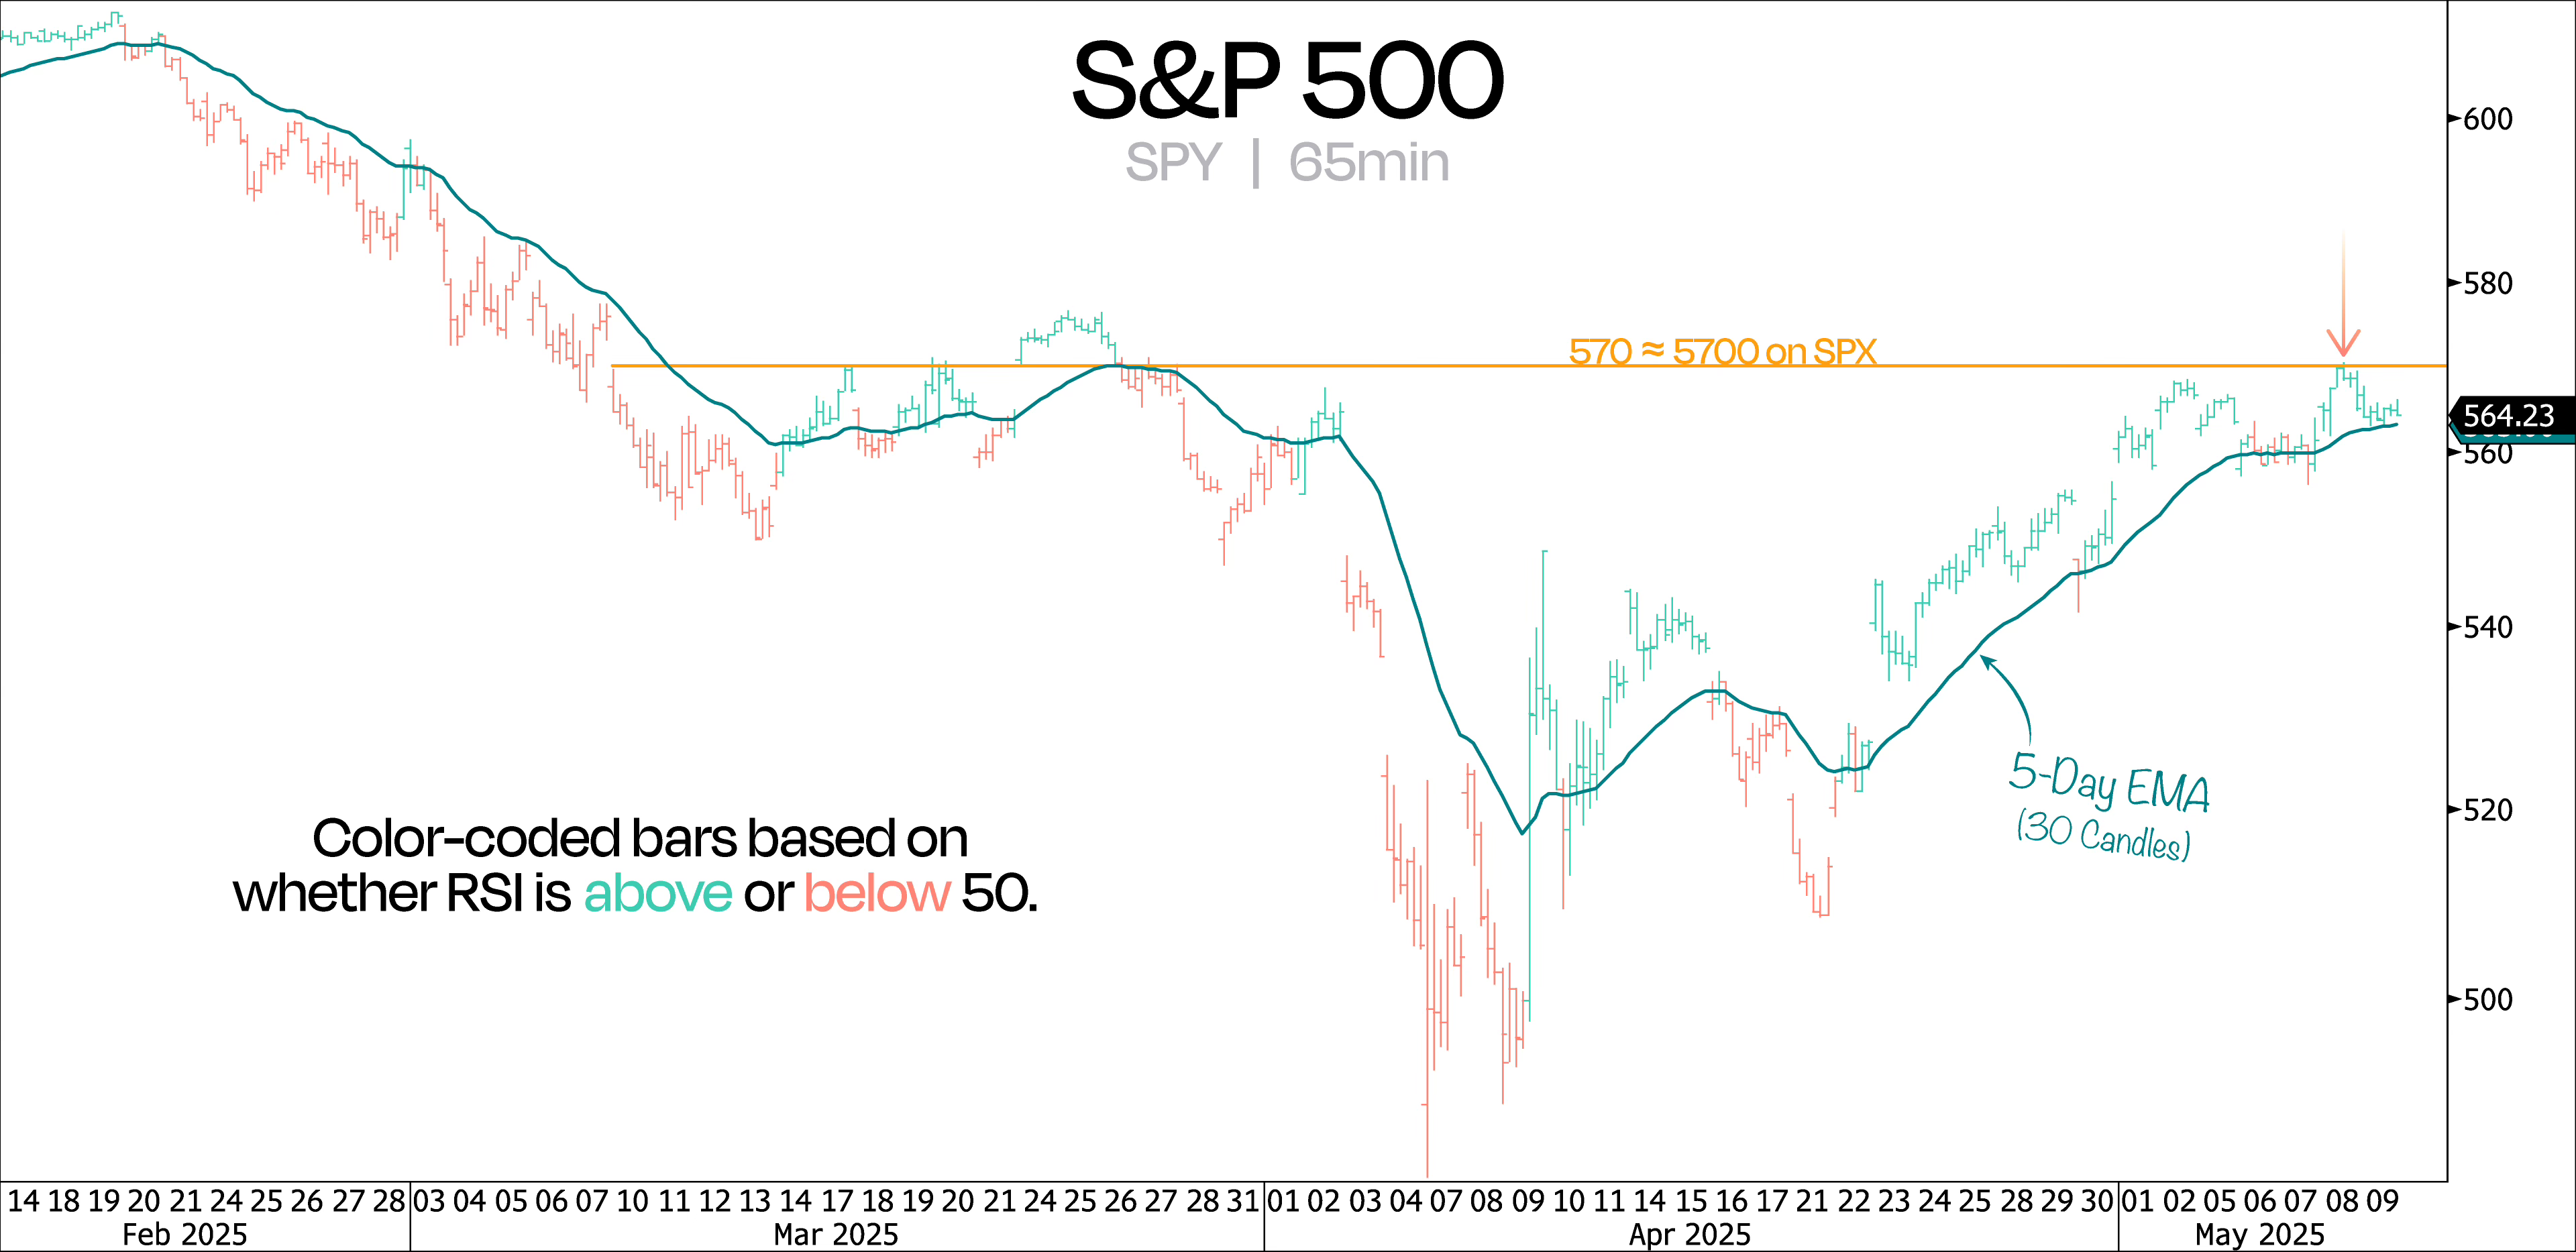
Right now, we’re focused on the short-term S&P 500 chart (65-minute candles).
As long as it stays above the 5-day EMA – which usually lines up with RSI holding above 50 – we’re good.
But if it slips below, we could be looking at a drop, maybe all the way down to 5500.
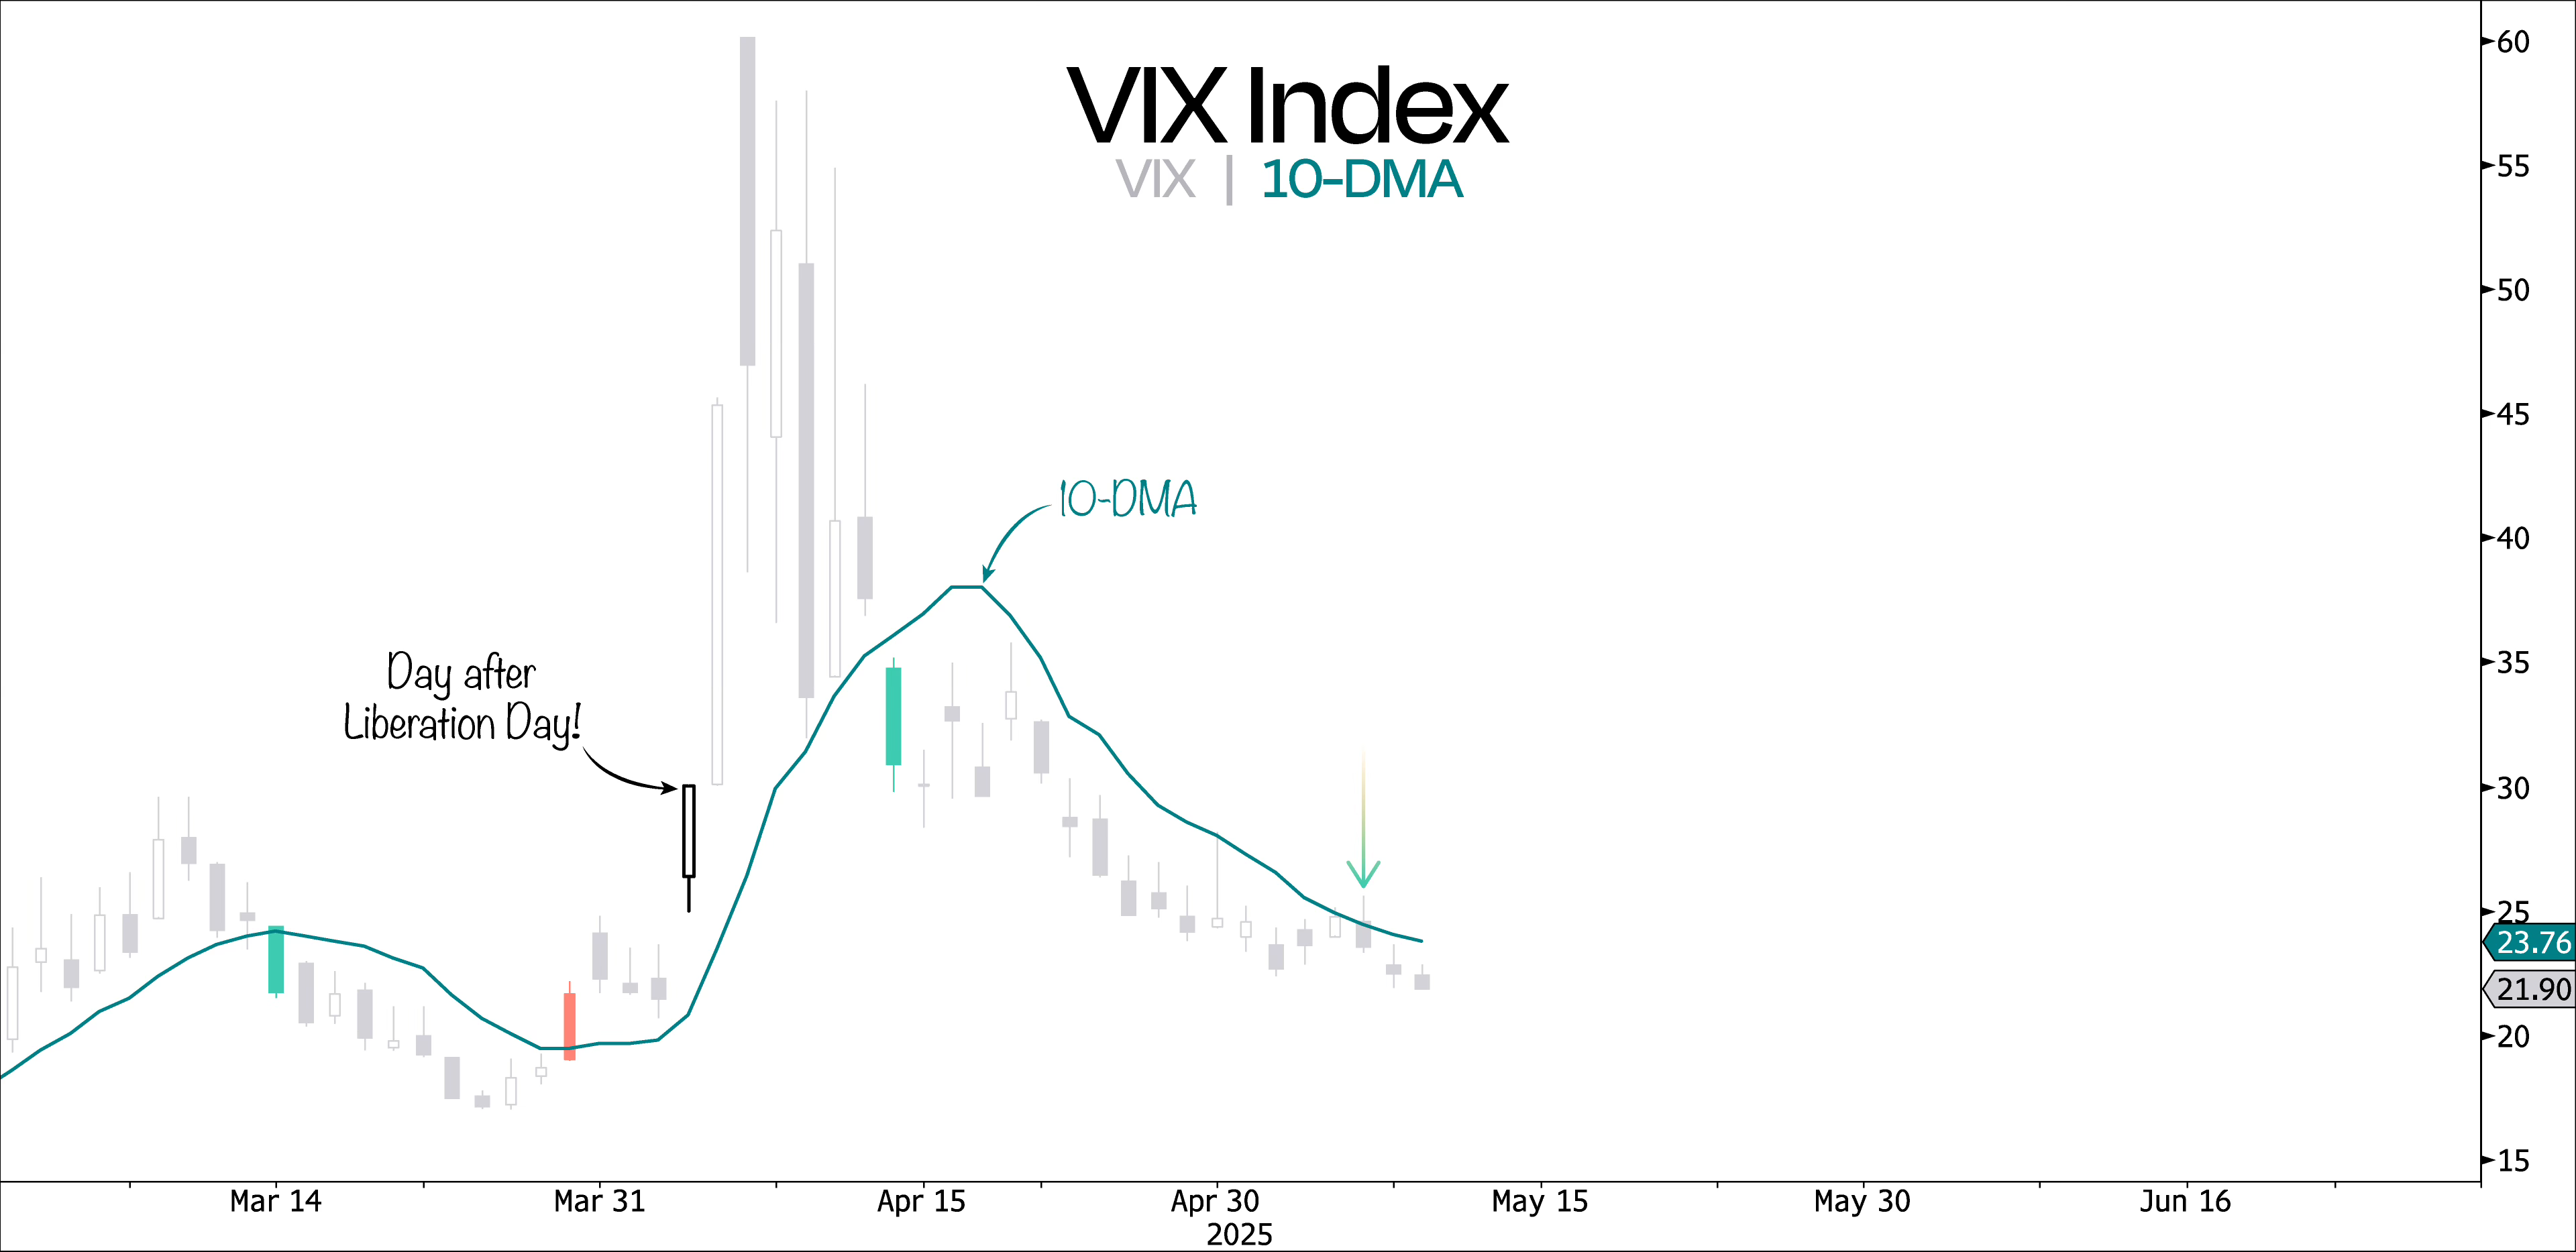
If we drop below that moving average, there’s a good chance the VIX pops above its 10-DMA too – which would definitely raise some red flags.
Since we haven’t seen a close above that level in a month, a move like that would likely be our signal to start putting on some hedges.
For sure, we’ll hit some bumps along the way, but with the lack of positioning, the S&P 500 is likely to keep grinding higher and making higher lows.
Not only will this shift sentiment, but we can also expect earnings revisions to start ticking up from here on out as well.
To make sense of this, keep in mind that analysts aren’t in the business of predicting – they’re in the business of reacting.
If you look at the next chart, you’ll see that since the S&P 500 peaked on February 19, earnings estimates have been getting cut.
But what really stands out is how Q1 earnings have been blowing past expectations, now that over 90% of S&P 500 companies have reported.
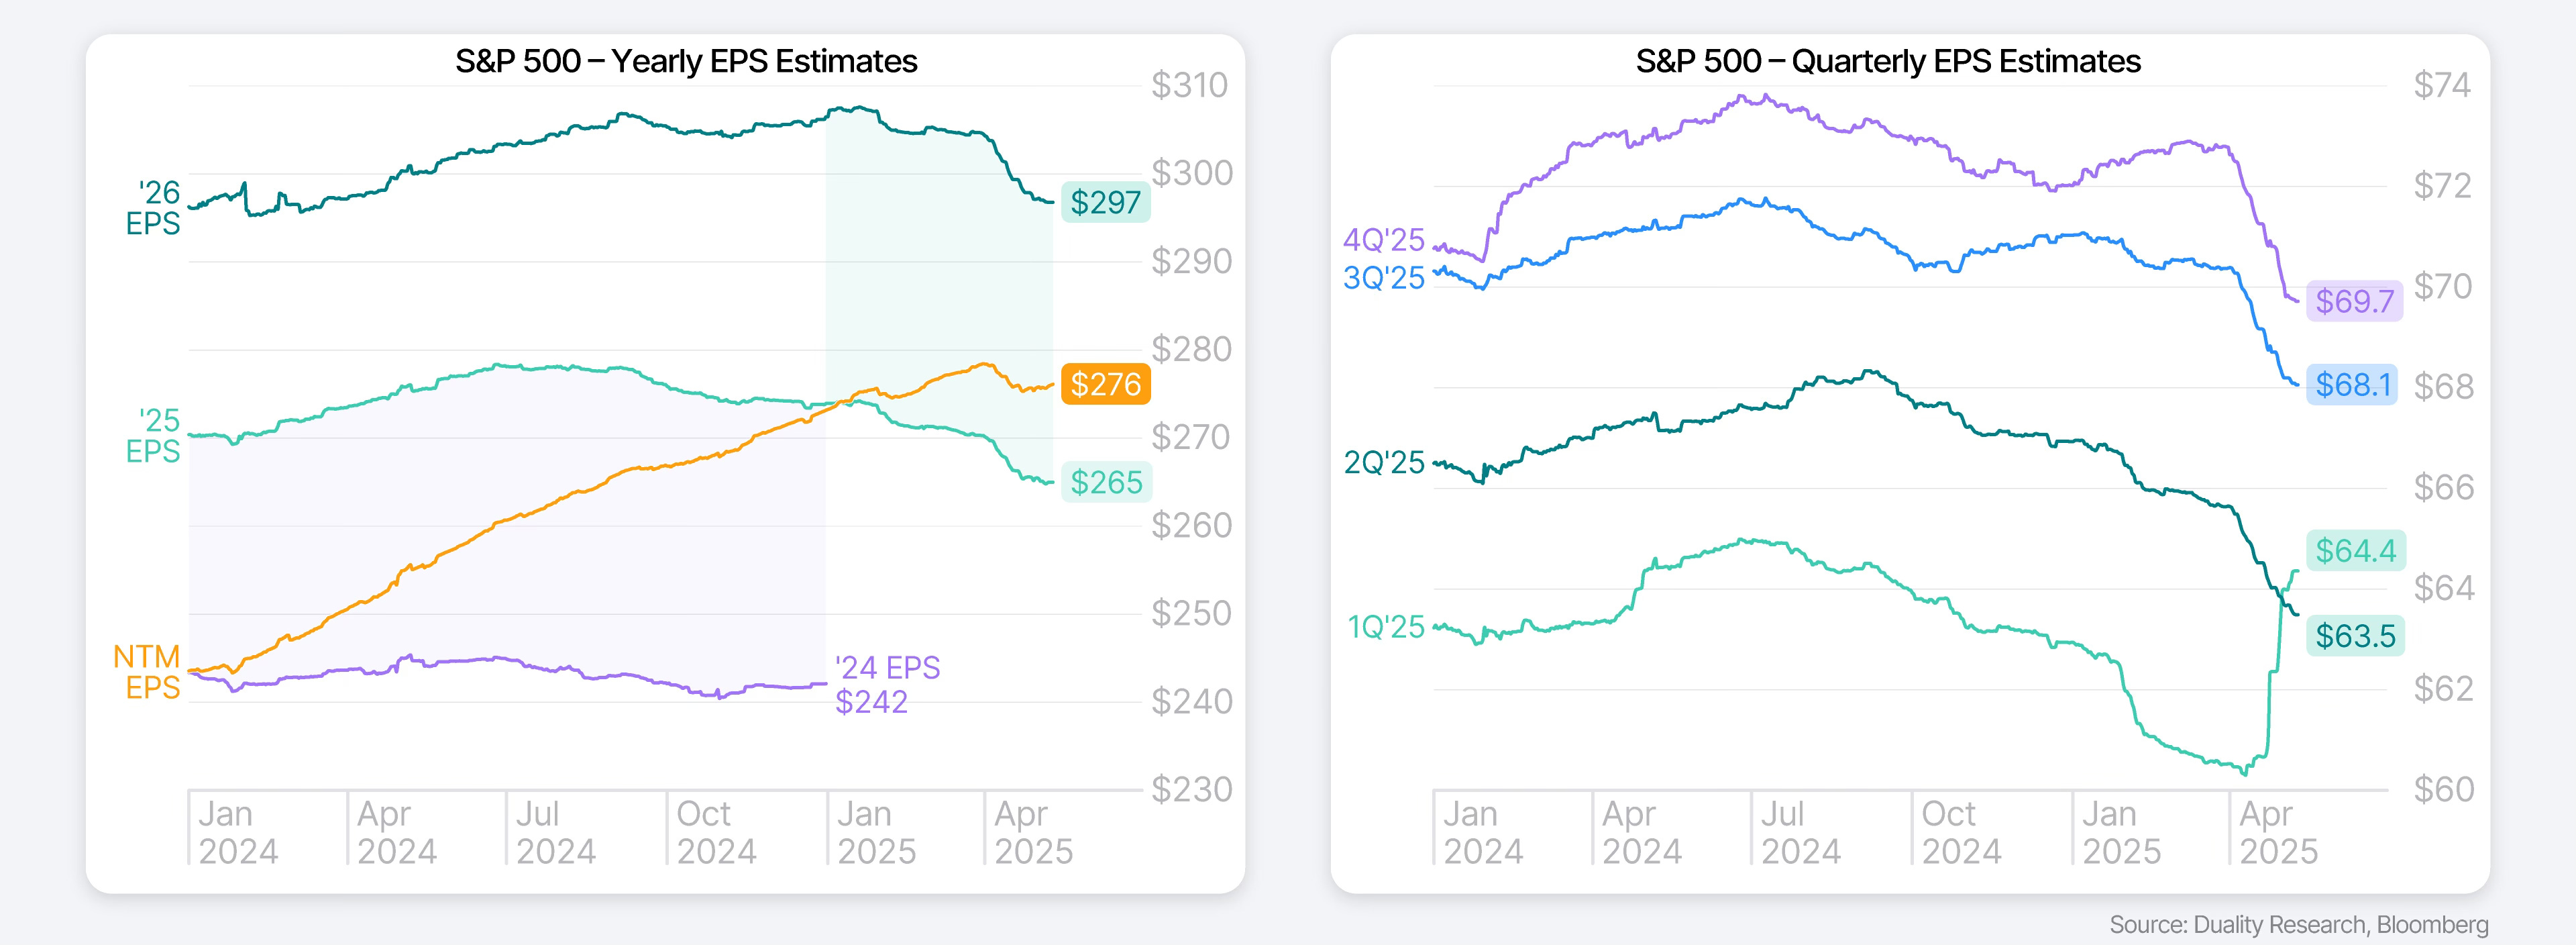
While the Street was initially expecting Q1 earnings growth of 7.1% YoY, the actual blended YoY EPS growth is currently coming in at 13.4%!
Now, of course, some people will say Q1 reflects a pre-tariff world, which might explain why future earnings estimates haven’t reversed higher so far.
But we’re starting to see signs that suggest those recent estimate cuts might have been a little too negative:
S&P 500 companies have been surprisingly upbeat about corporate profitability.
A significantly higher-than-usual number of companies are maintaining guidance (58% vs a historical average of 41%) – and only 1% of companies have withdrawn their guidance, compared to the long-term average of 5% since 2007.
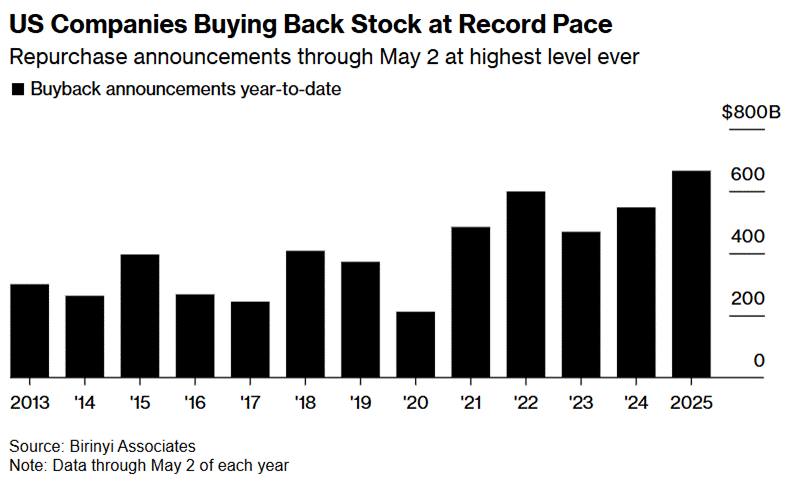
But perhaps most importantly, US companies are buying back stock like never before, with the median buyback announcement topping 5% of market cap.
That’s a strong signal!
We’ve seen companies ramp up their buying before – like in Q1 2023 during the SVB crisis, and during the first half of 2022 when markets were shaken up by the Ukraine war and inflation fears.
To us, it’s clear – US companies are buying back stock at the fastest pace in years because they know things aren’t as bad as most people think!
So, as the market keeps grinding higher, expect sentiment to catch up, and earnings revisions to start moving up again.
Meanwhile, CTAs will have to keep chasing, and those sitting on the sidelines may soon find themselves scrambling to catch up as the S&P 500 hits new highs.