
Broad Bull, Tactical Tech
Thoughts on the Market

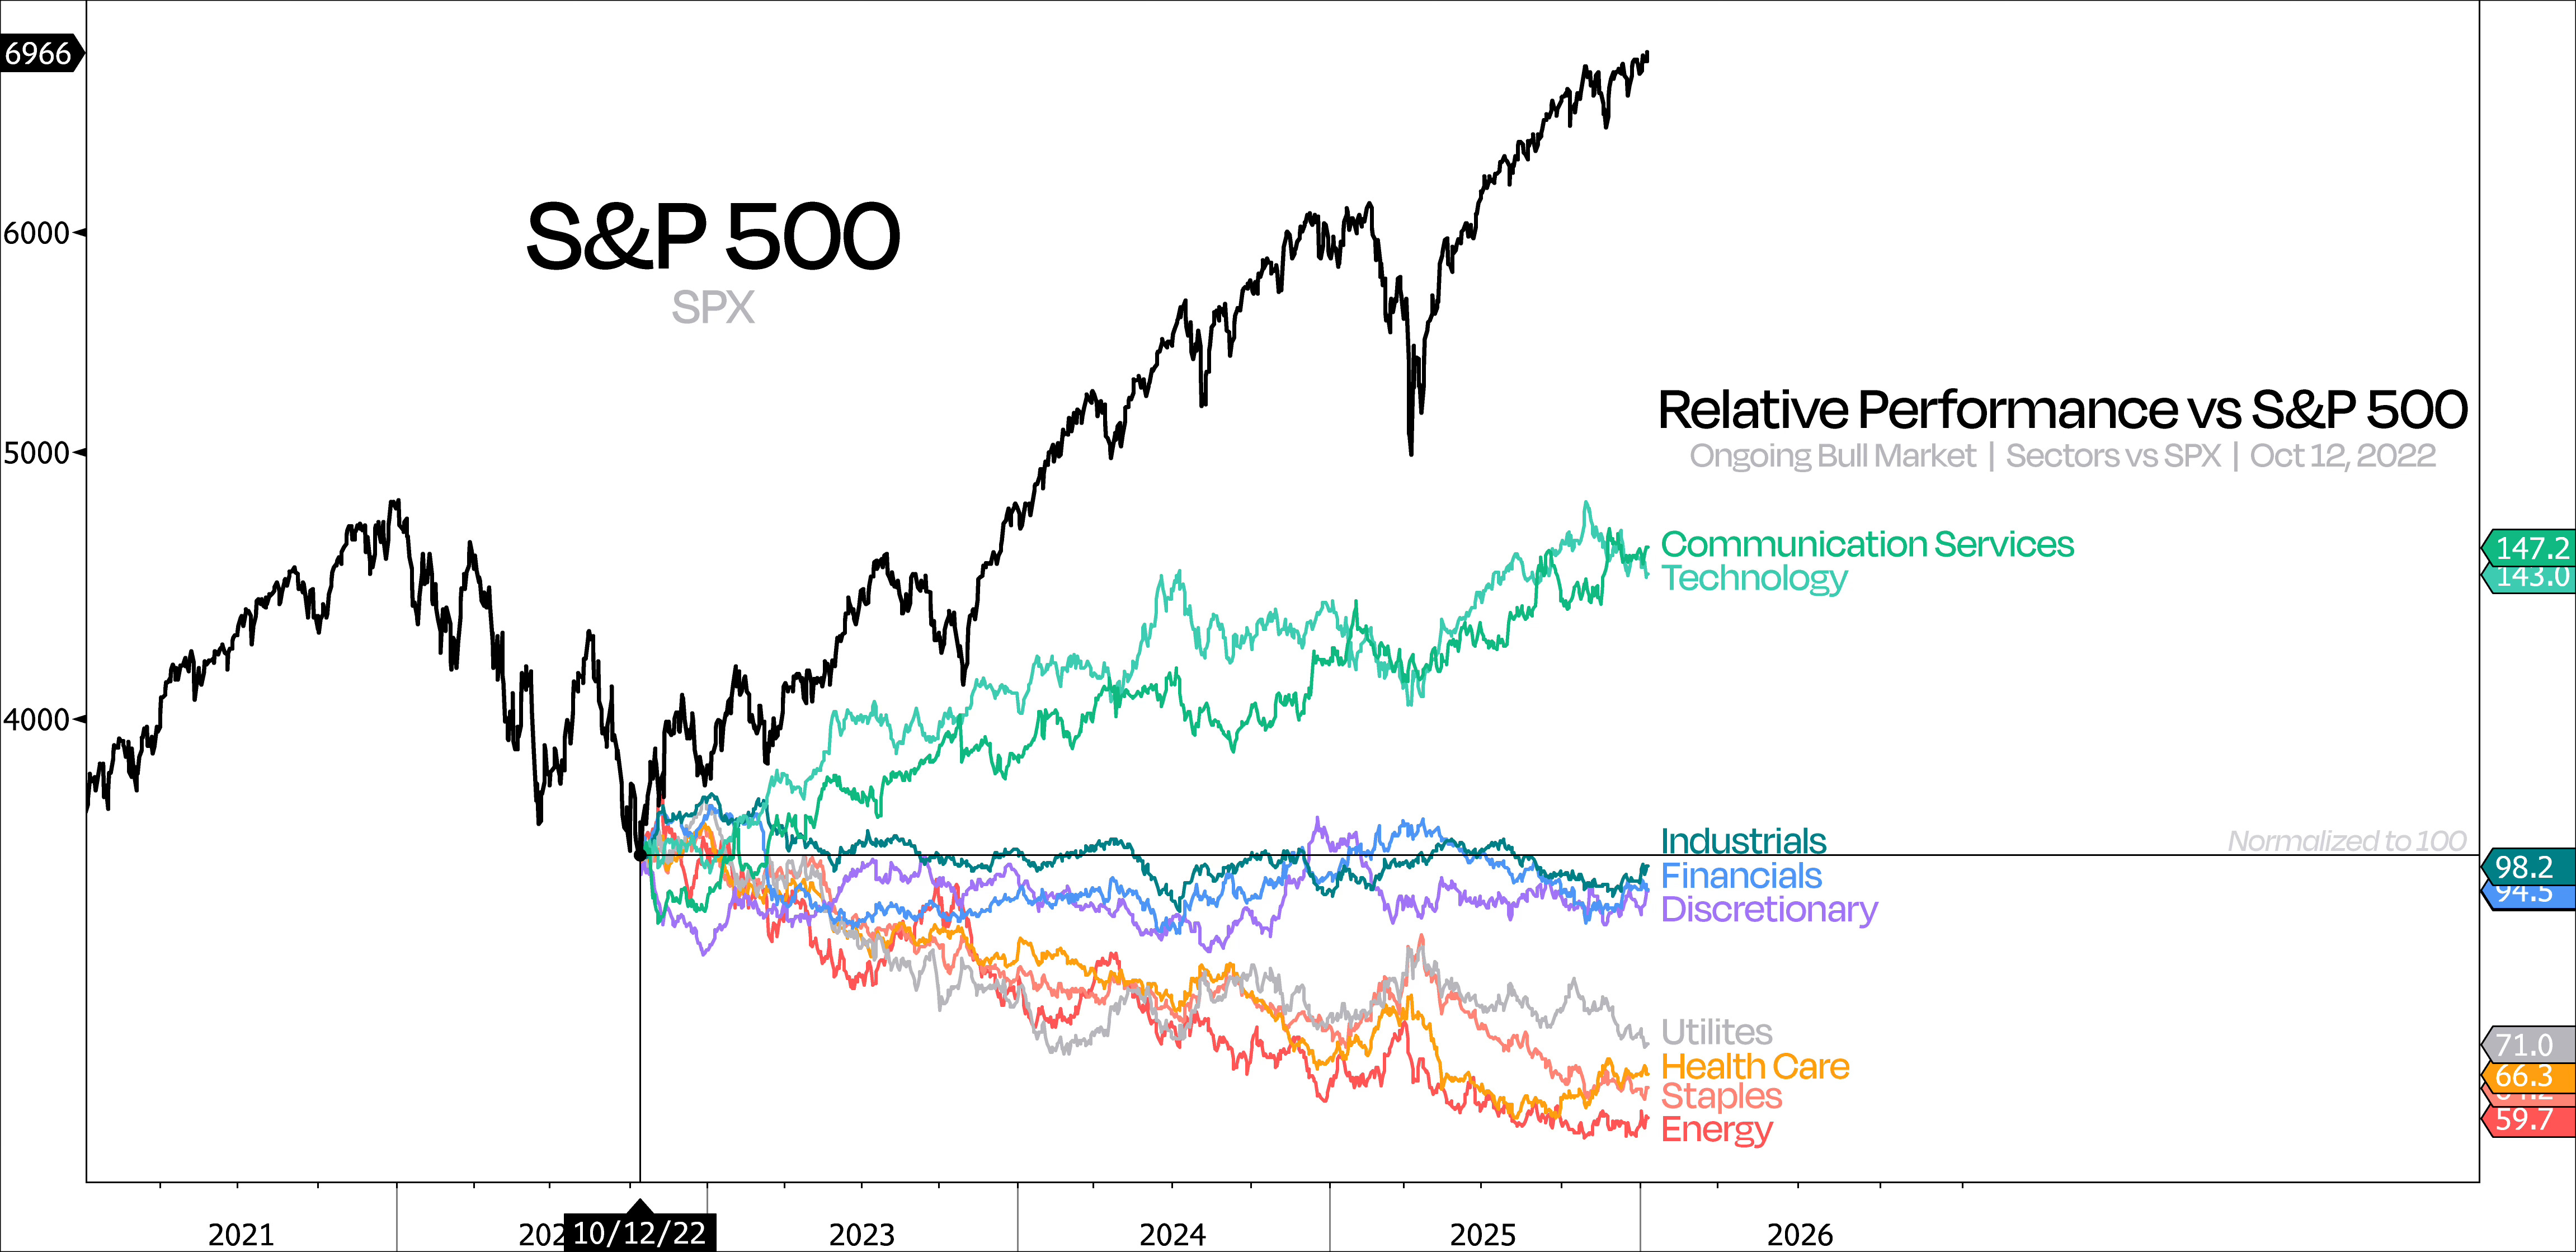
There’s no question that this 3-year bull market has been all about Tech.
Since the S&P 500 bottomed on October 12, 2022 — 39 months ago — only Technology and Communication Services have managed to beat the market. Everything else has underperformed.
Now, what’s interesting is that over the past 18 months — almost half of this AI-driven bull run — Technology has actually lagged the rest of the market.
Not by a lot, but enough to matter — especially when you consider that this is happening during a bull market.
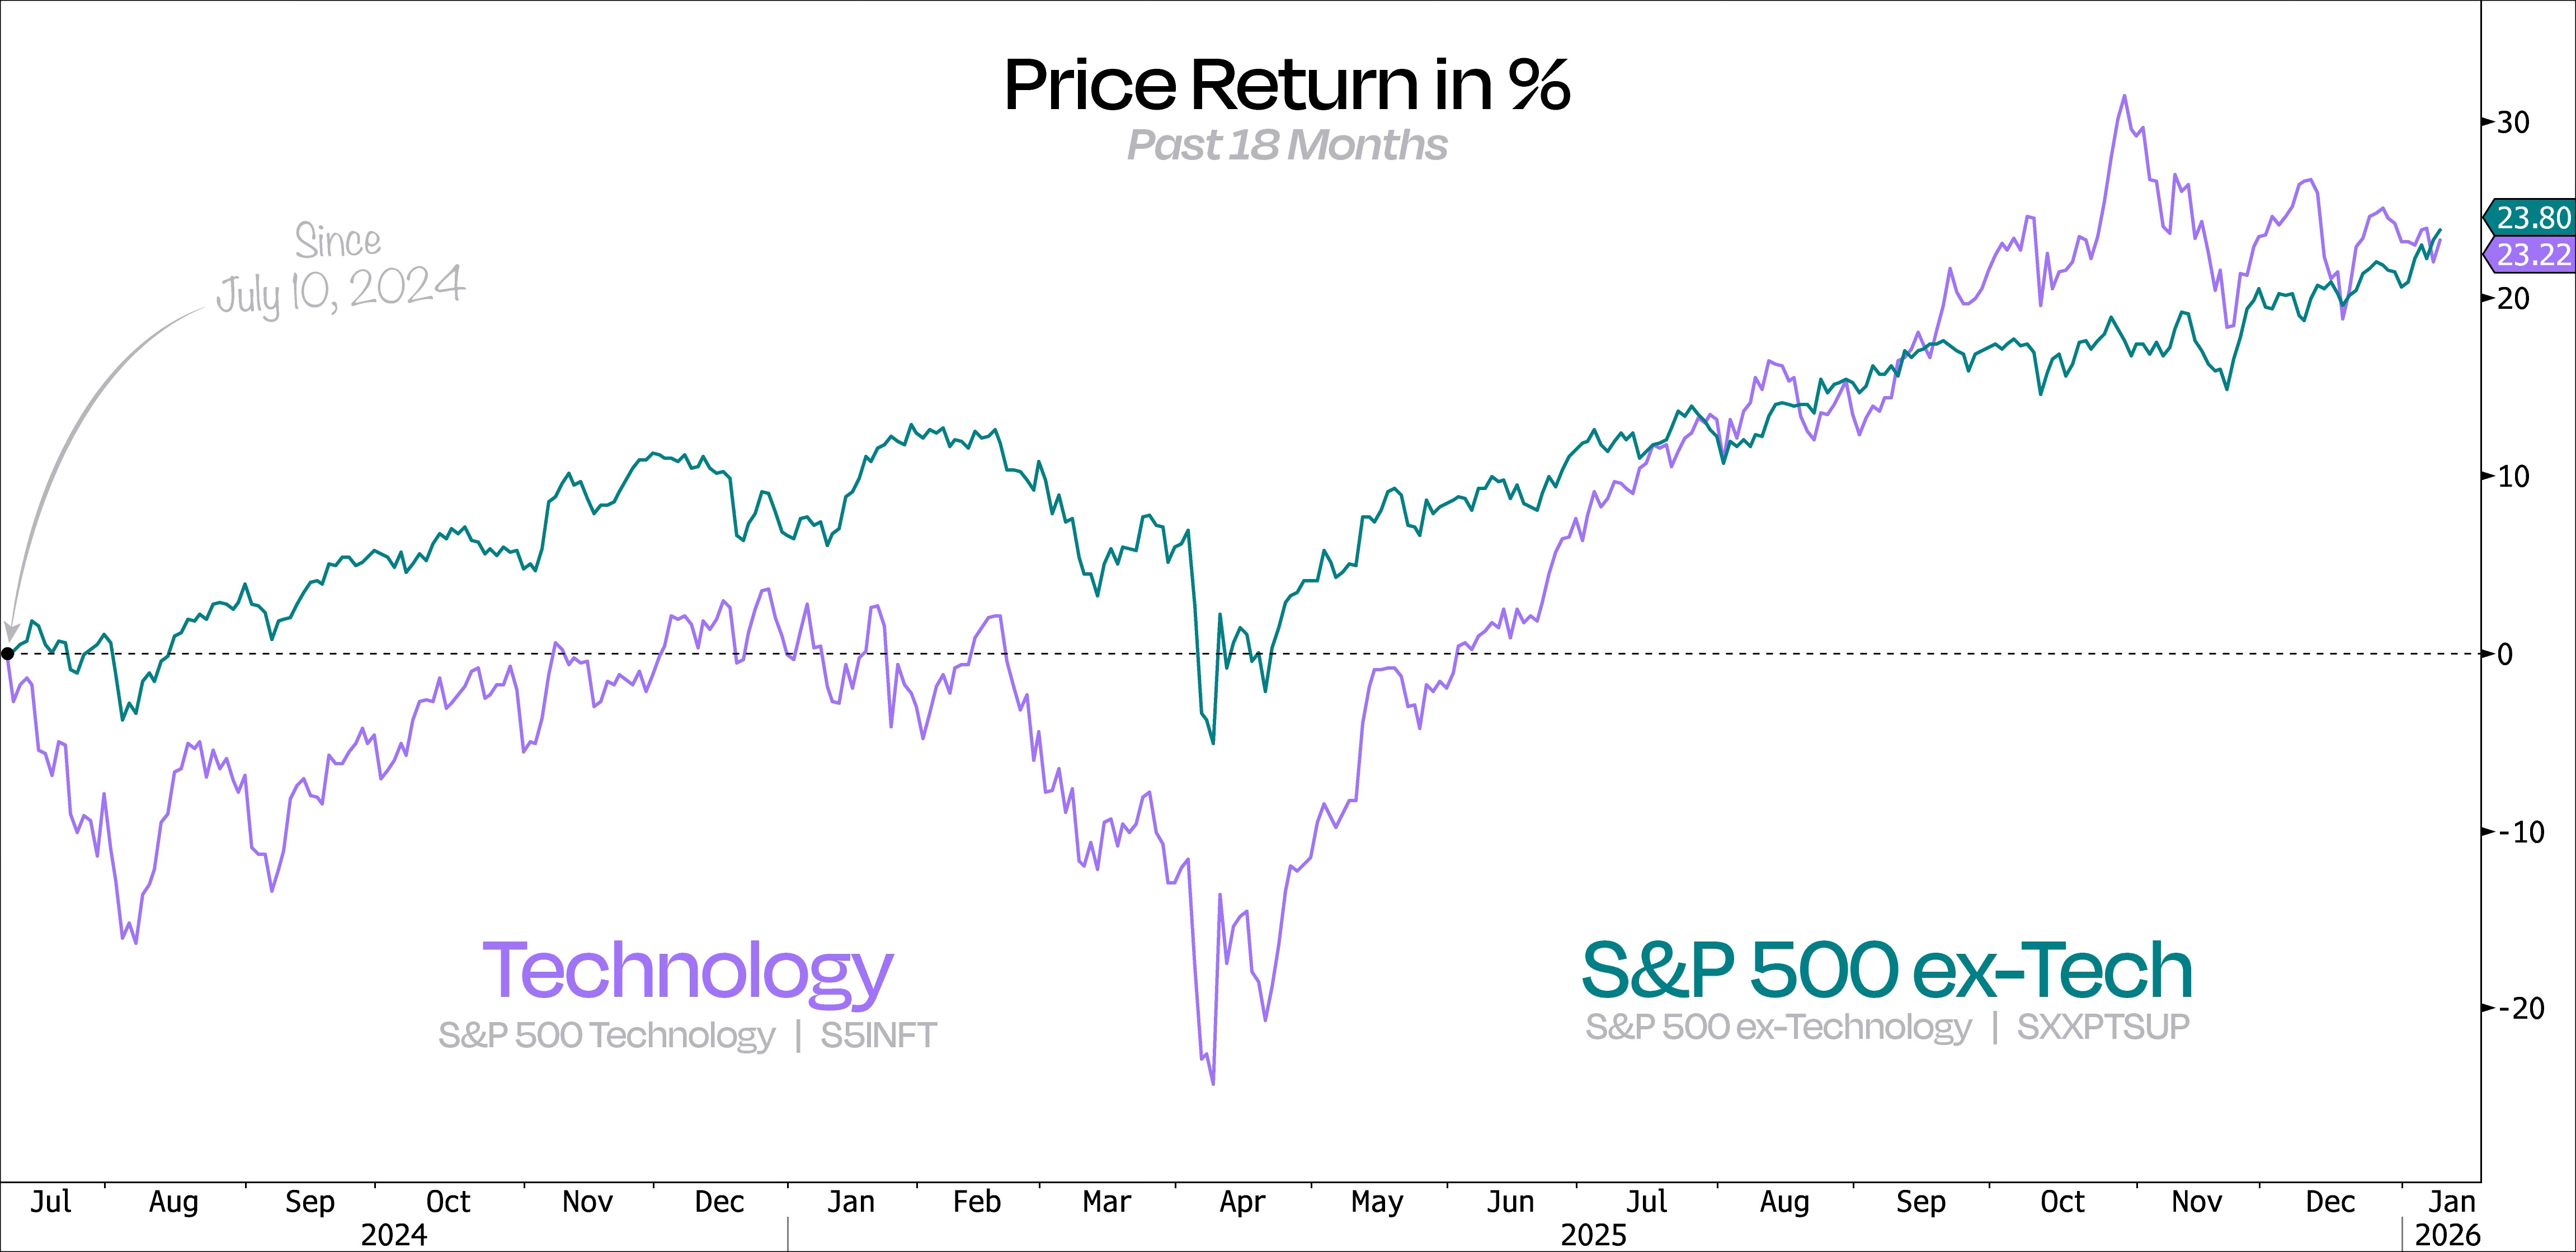
When you zoom in, you can see something clearly shifted in the AI trade around the time Powell pushed back on further rate cuts. At the same time, the market started to broaden, which helped keep the S&P 500 supported.
So while it looks like the index has gone nowhere lately, there’s been a ton going on under the hood — most of it a pretty aggressive rotation out of Technology.
In other words, Tech’s recent weakness goes a long way toward explaining why it’s underperformed the rest of the market over the past 18 months.
This has actually played right into our hands, since for the past four months we’ve been saying to look past the usual suspects.
It’s not just that the market is broadening — it’s that certain groups of stocks are showing real relative strength vs the S&P 500.
Our preferred way to play that has been through small-caps, and more recently we’ve doubled down on that view. But more generally, we see the average stock doing well in 2026, especially in cyclical sectors like Financials, Industrials, and Consumer Discretionary.
Along with small-caps, these are the areas where earnings growth is expected to accelerate meaningfully this year. Plus, the Fed looks set to keep cutting rates.
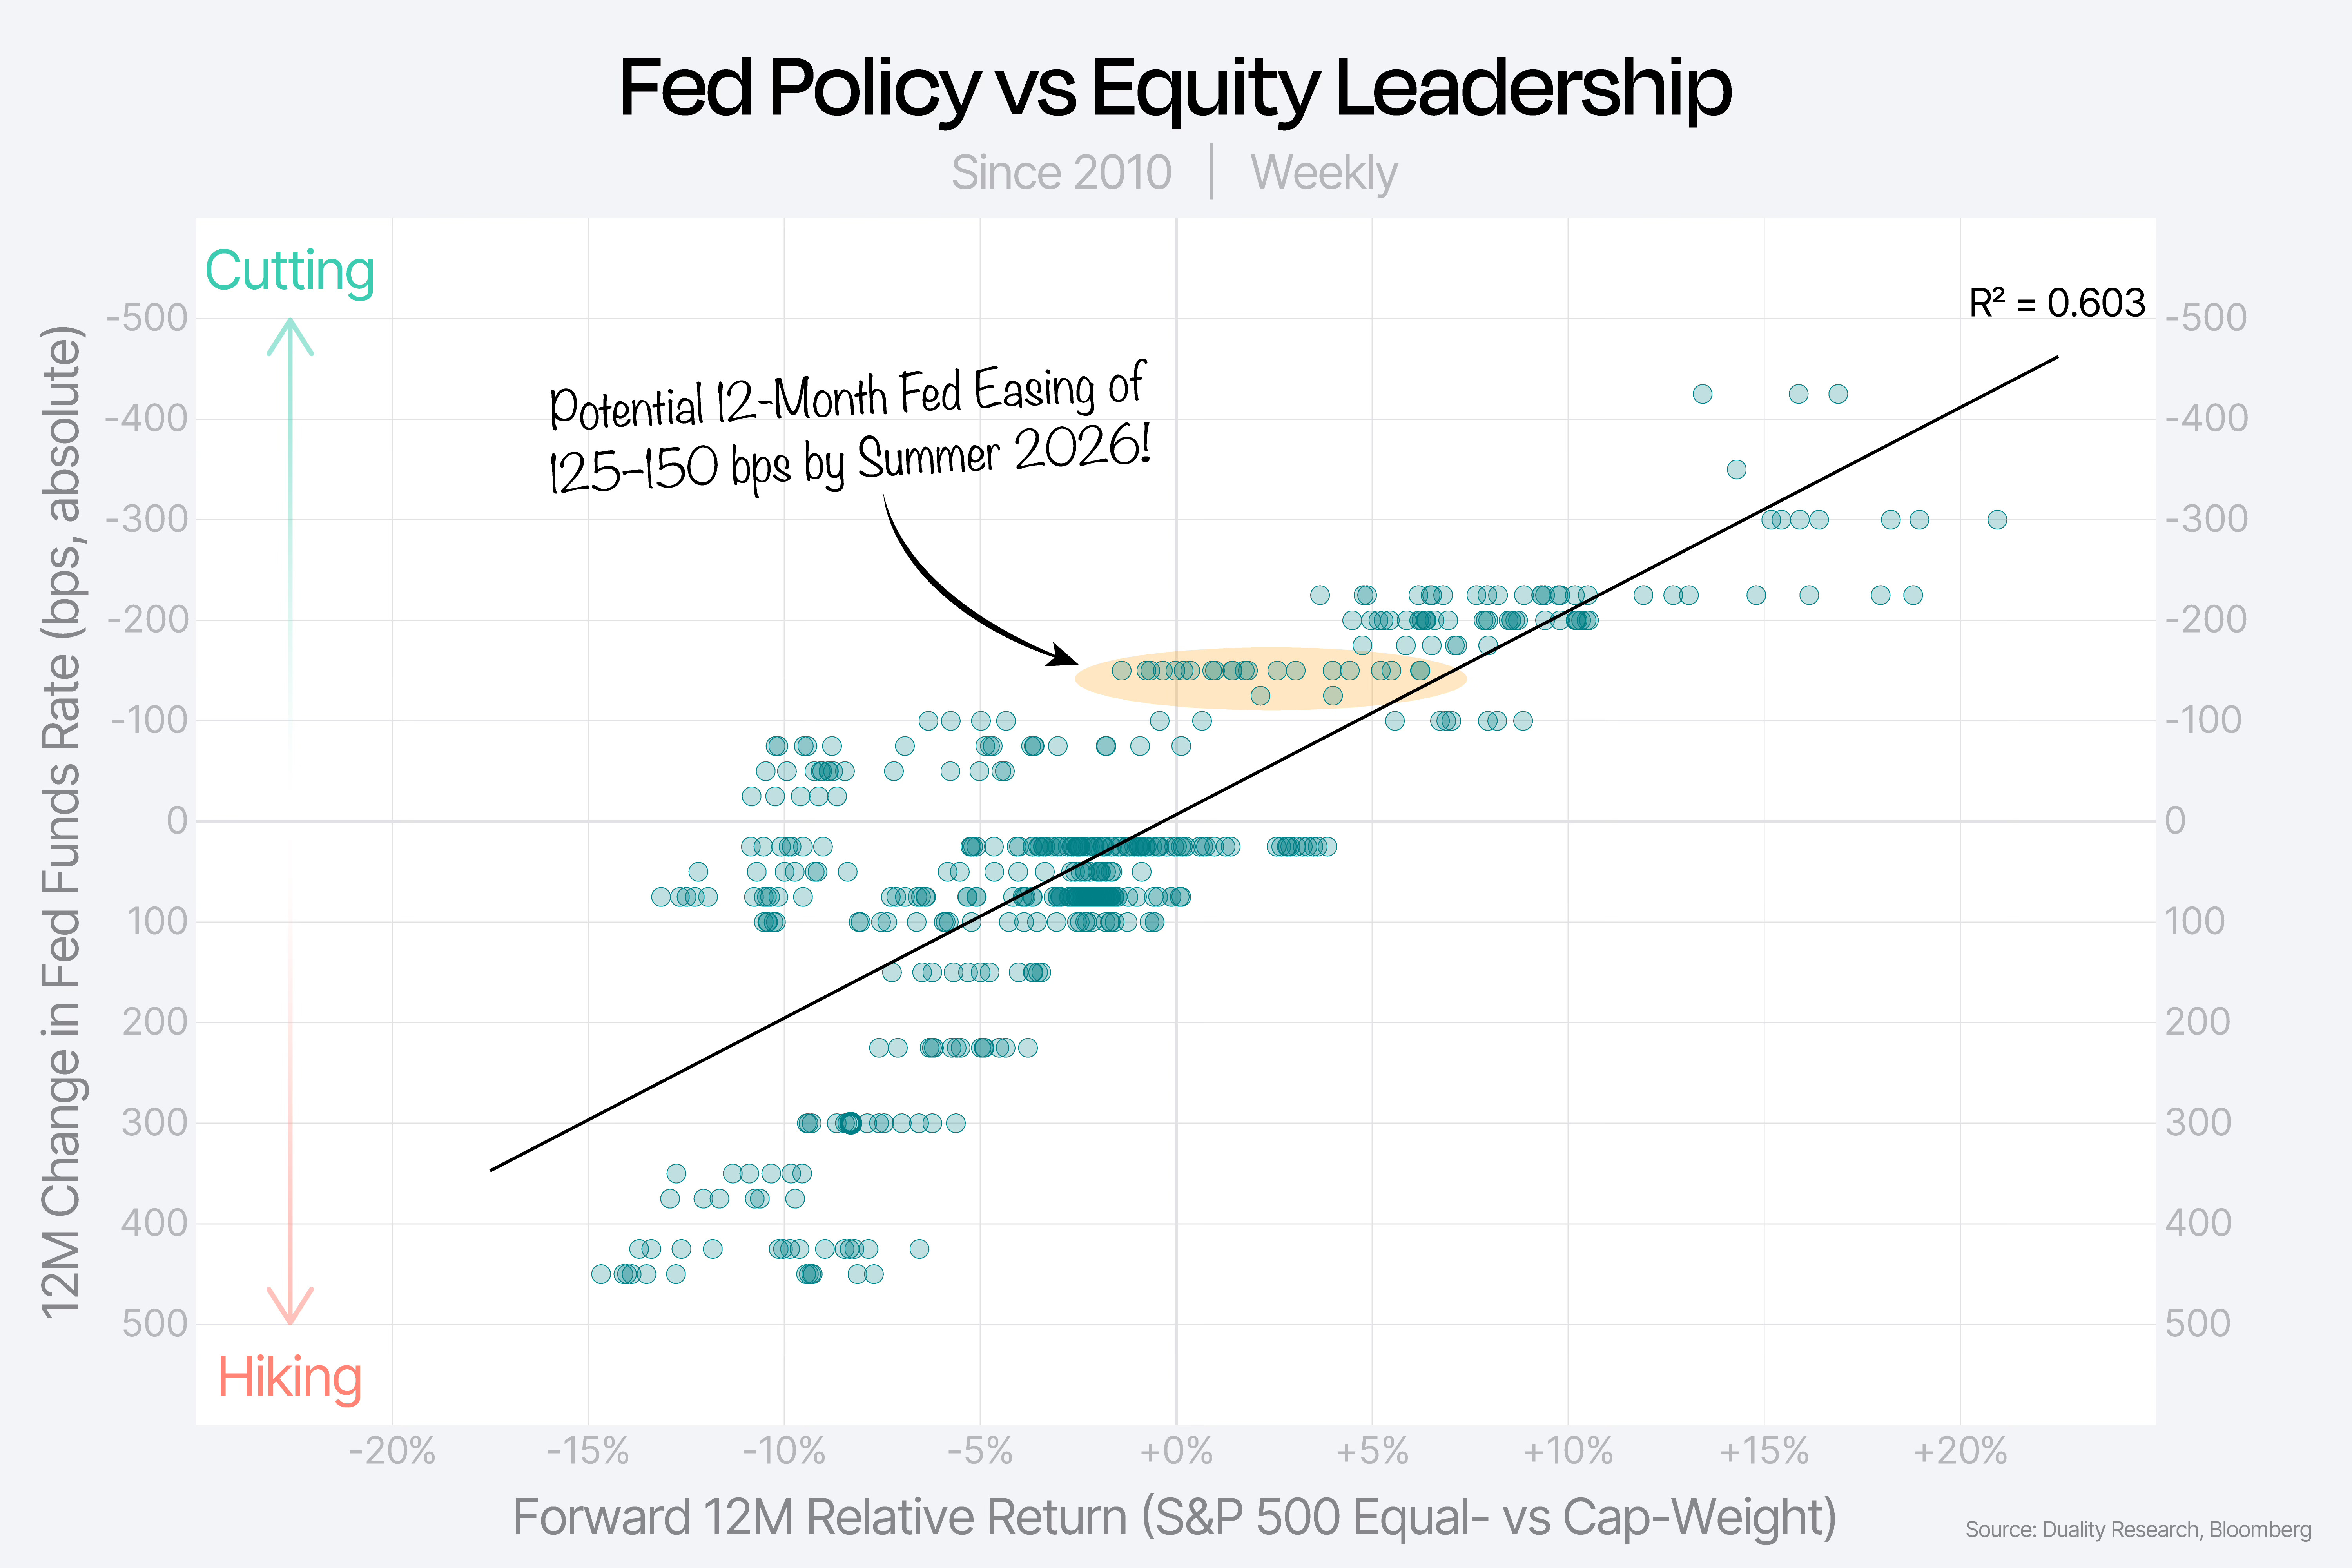
Why does that matter? History shows that when the Fed is cutting, the equal-weight S&P 500 tends to outperform the cap-weighted index. That makes for a pretty bullish setup for the broader market.
Our next chart makes it clear: since 2010, whenever the Fed cut rates over the past year, the equal-weighted index outperformed in the year that followed. When rates were hiked, it underperformed.
Right now, the Fed has already cut 75 basis points over the past 12 months. If we get to 125-150 by summer, the odds will keep stacking in favor of the broader market.
Markets are expecting another 50 basis points of rate cuts by September, with roughly a 20% chance of at least 75. That could bring total Fed easing over 12 months to 125–150 bps.
While that’s still our big-picture view for 2026, we can’t ignore it when the pendulum swings too far in one direction.
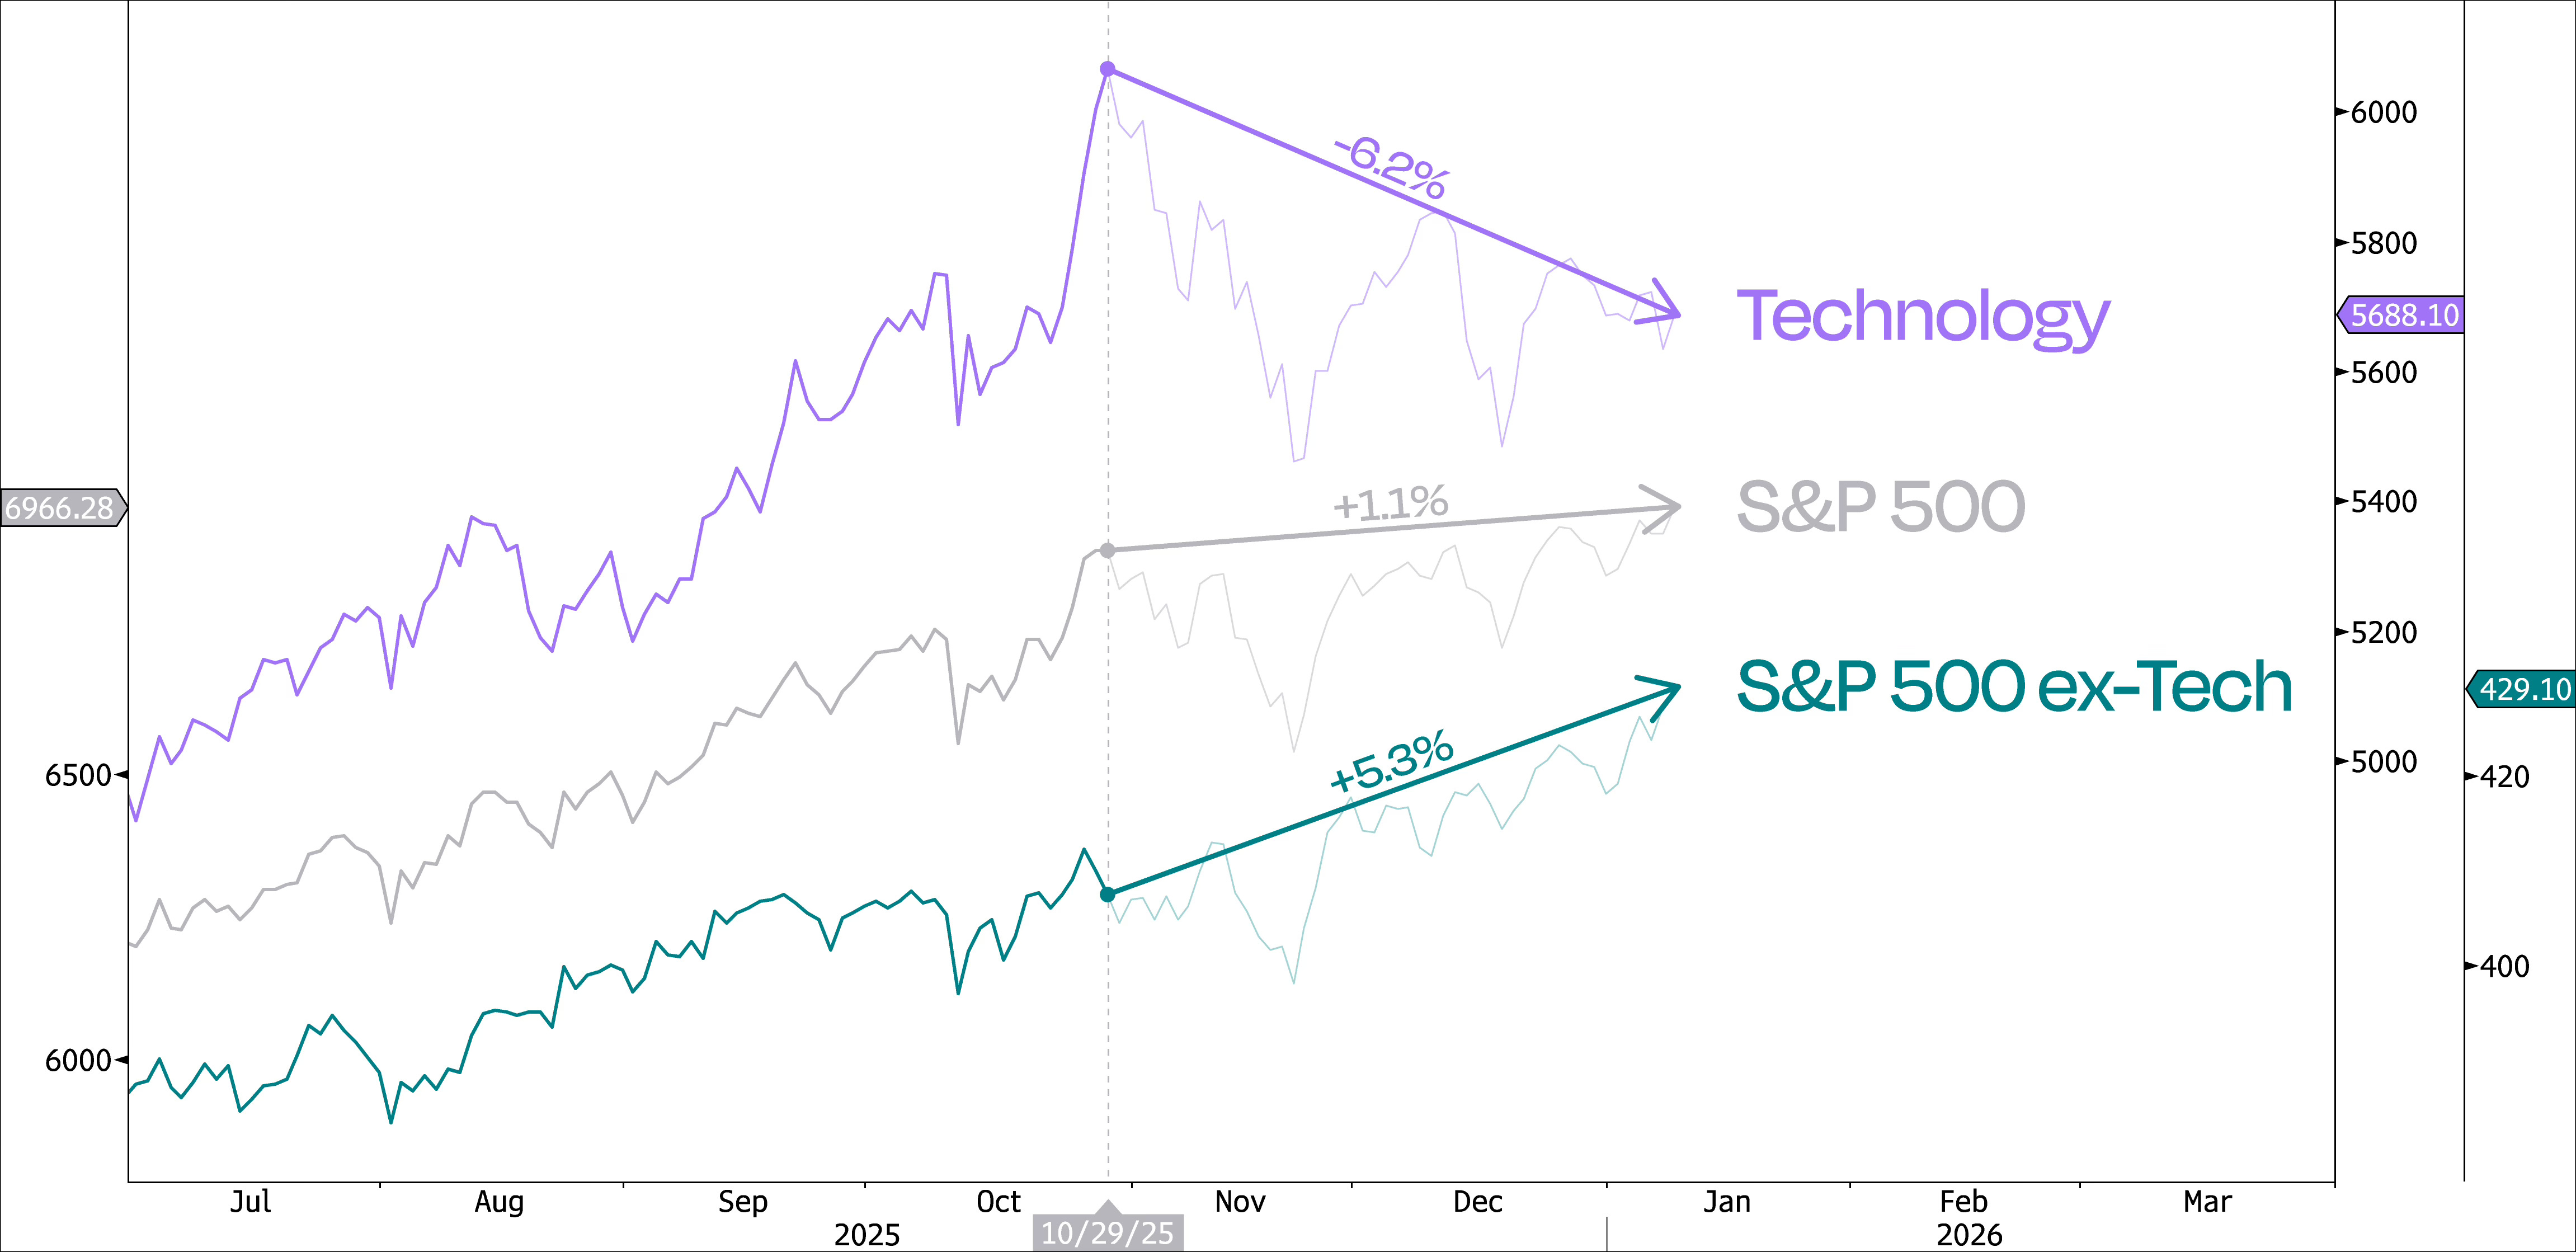
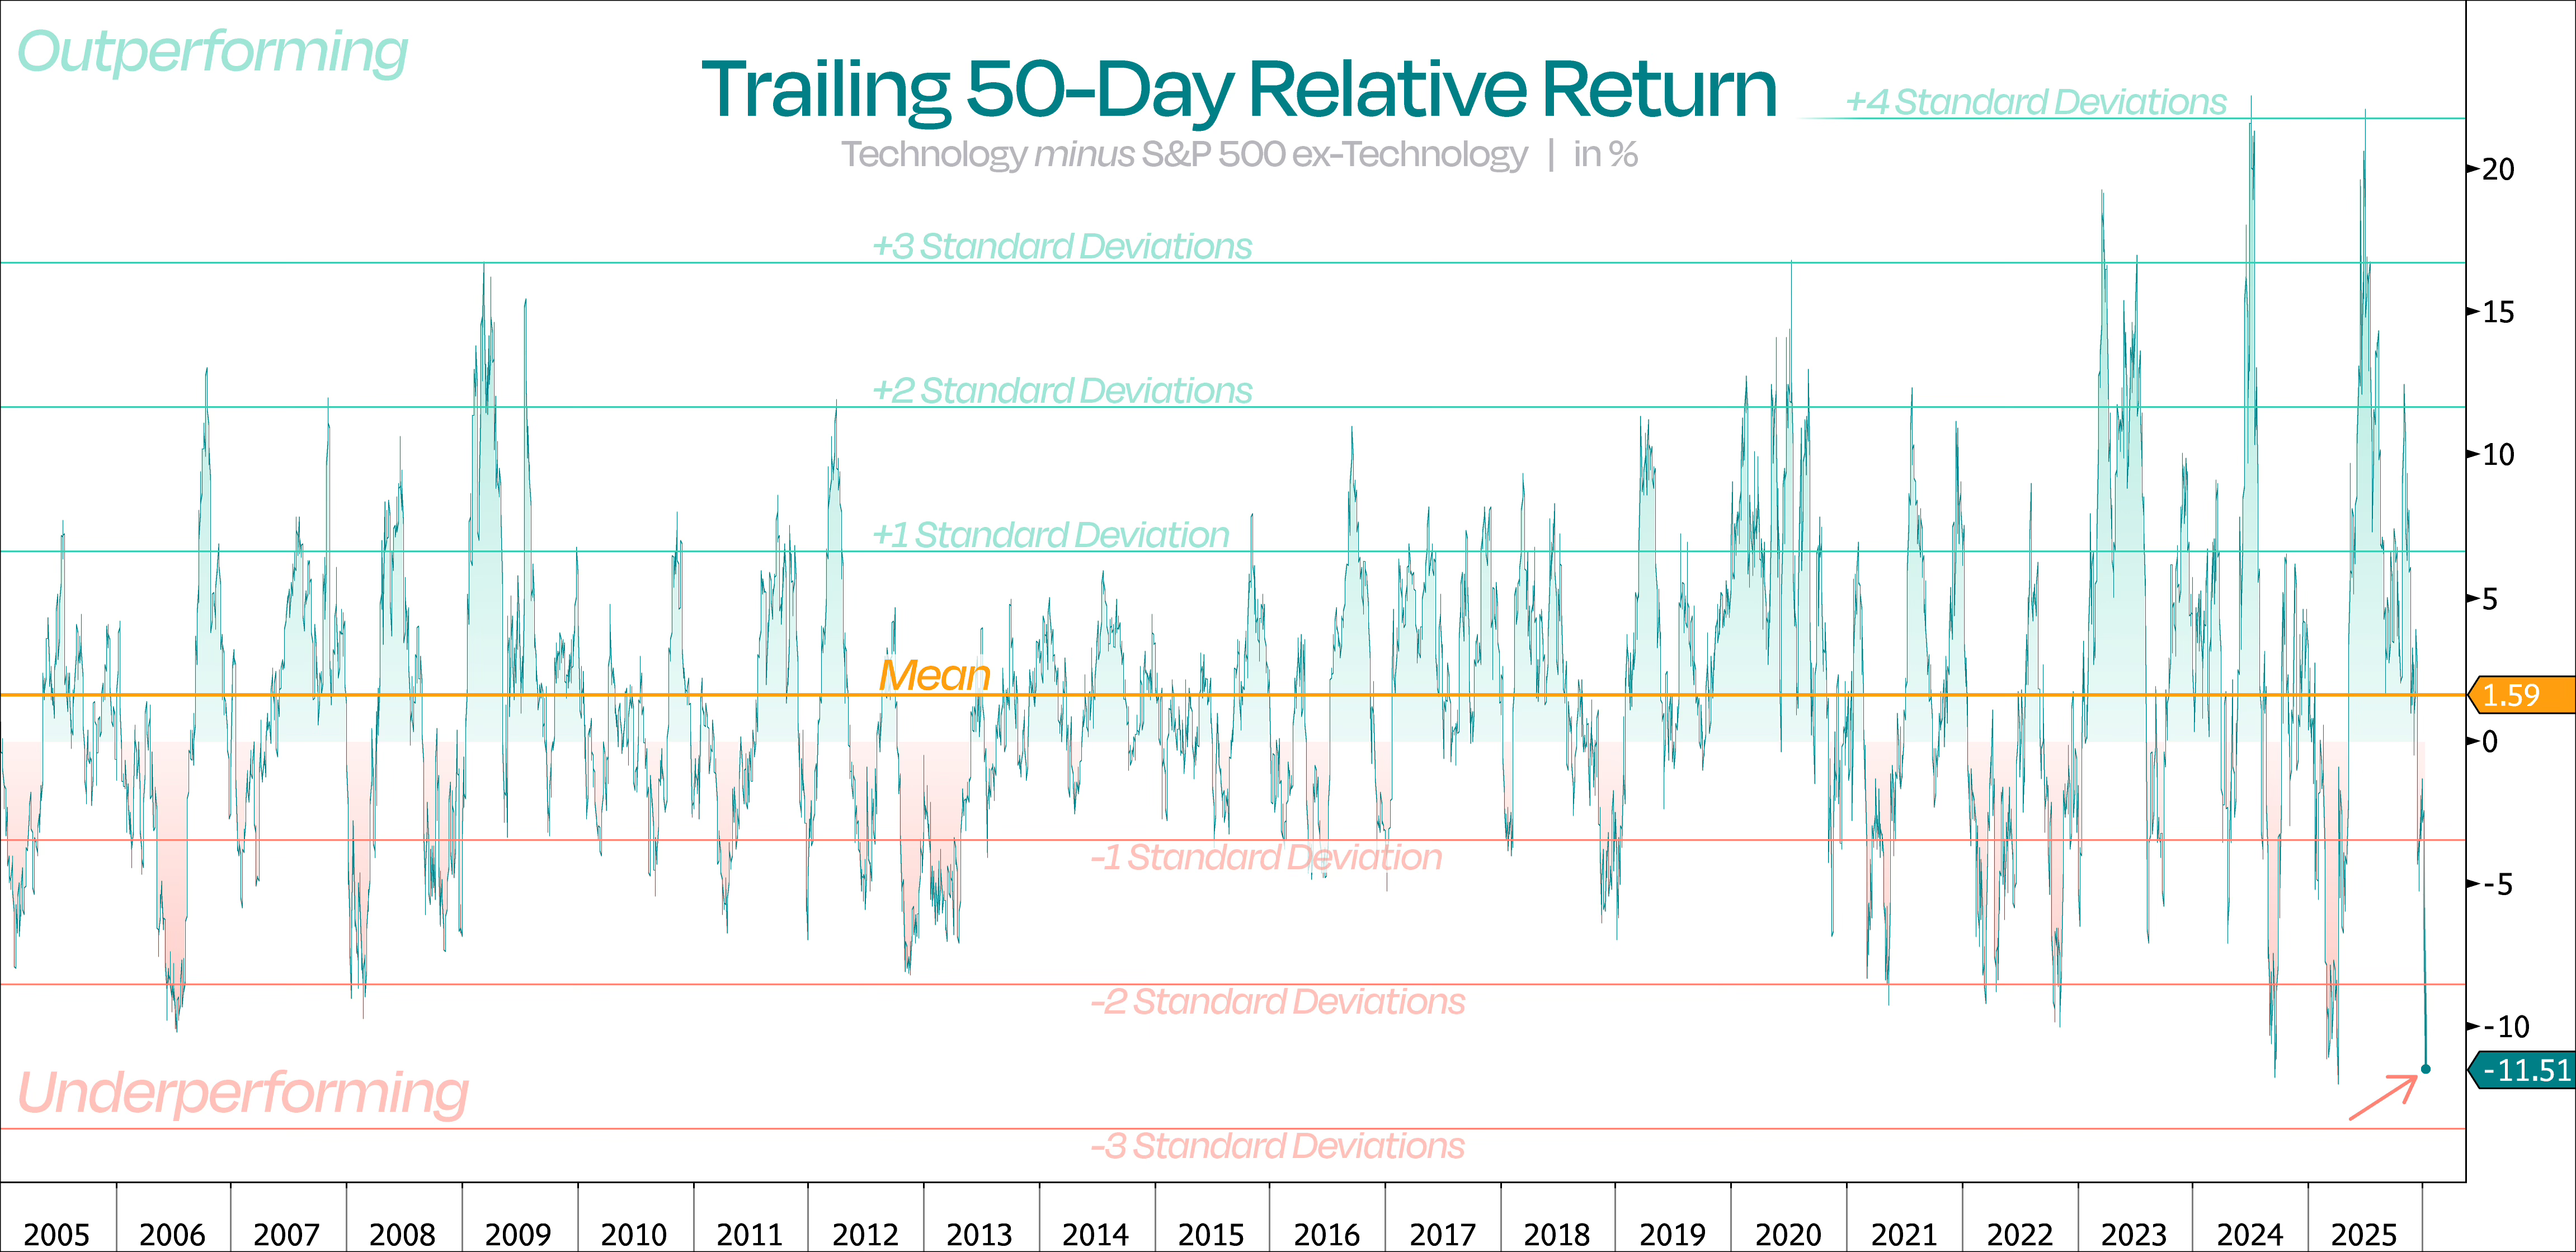
As we saw earlier, Technology has dropped over 6% since October 29, while the rest of the market — the S&P 500 ex-Tech — has gained more than 5%. That’s a massive swing of nearly 12 percentage points in just 50 trading days.
Put in perspective, it doesn’t get much worse than this.
50-day relative returns are nearly 3 standard deviations below the 20-year average. Normally, Tech outperforms the rest of the market by about 1.6 percentage points over 50 days.
Basically, the rest of the market usually lags, not the other way around. So this sharp underperformance tells us it’s pretty oversold on a relative basis.
When the line is above 0%, Tech is outperforming the rest of the market. Below 0%, it’s lagging. Right now, it’s currently in the lowest percentile (0th) – which could be your setup for a relative bounce.
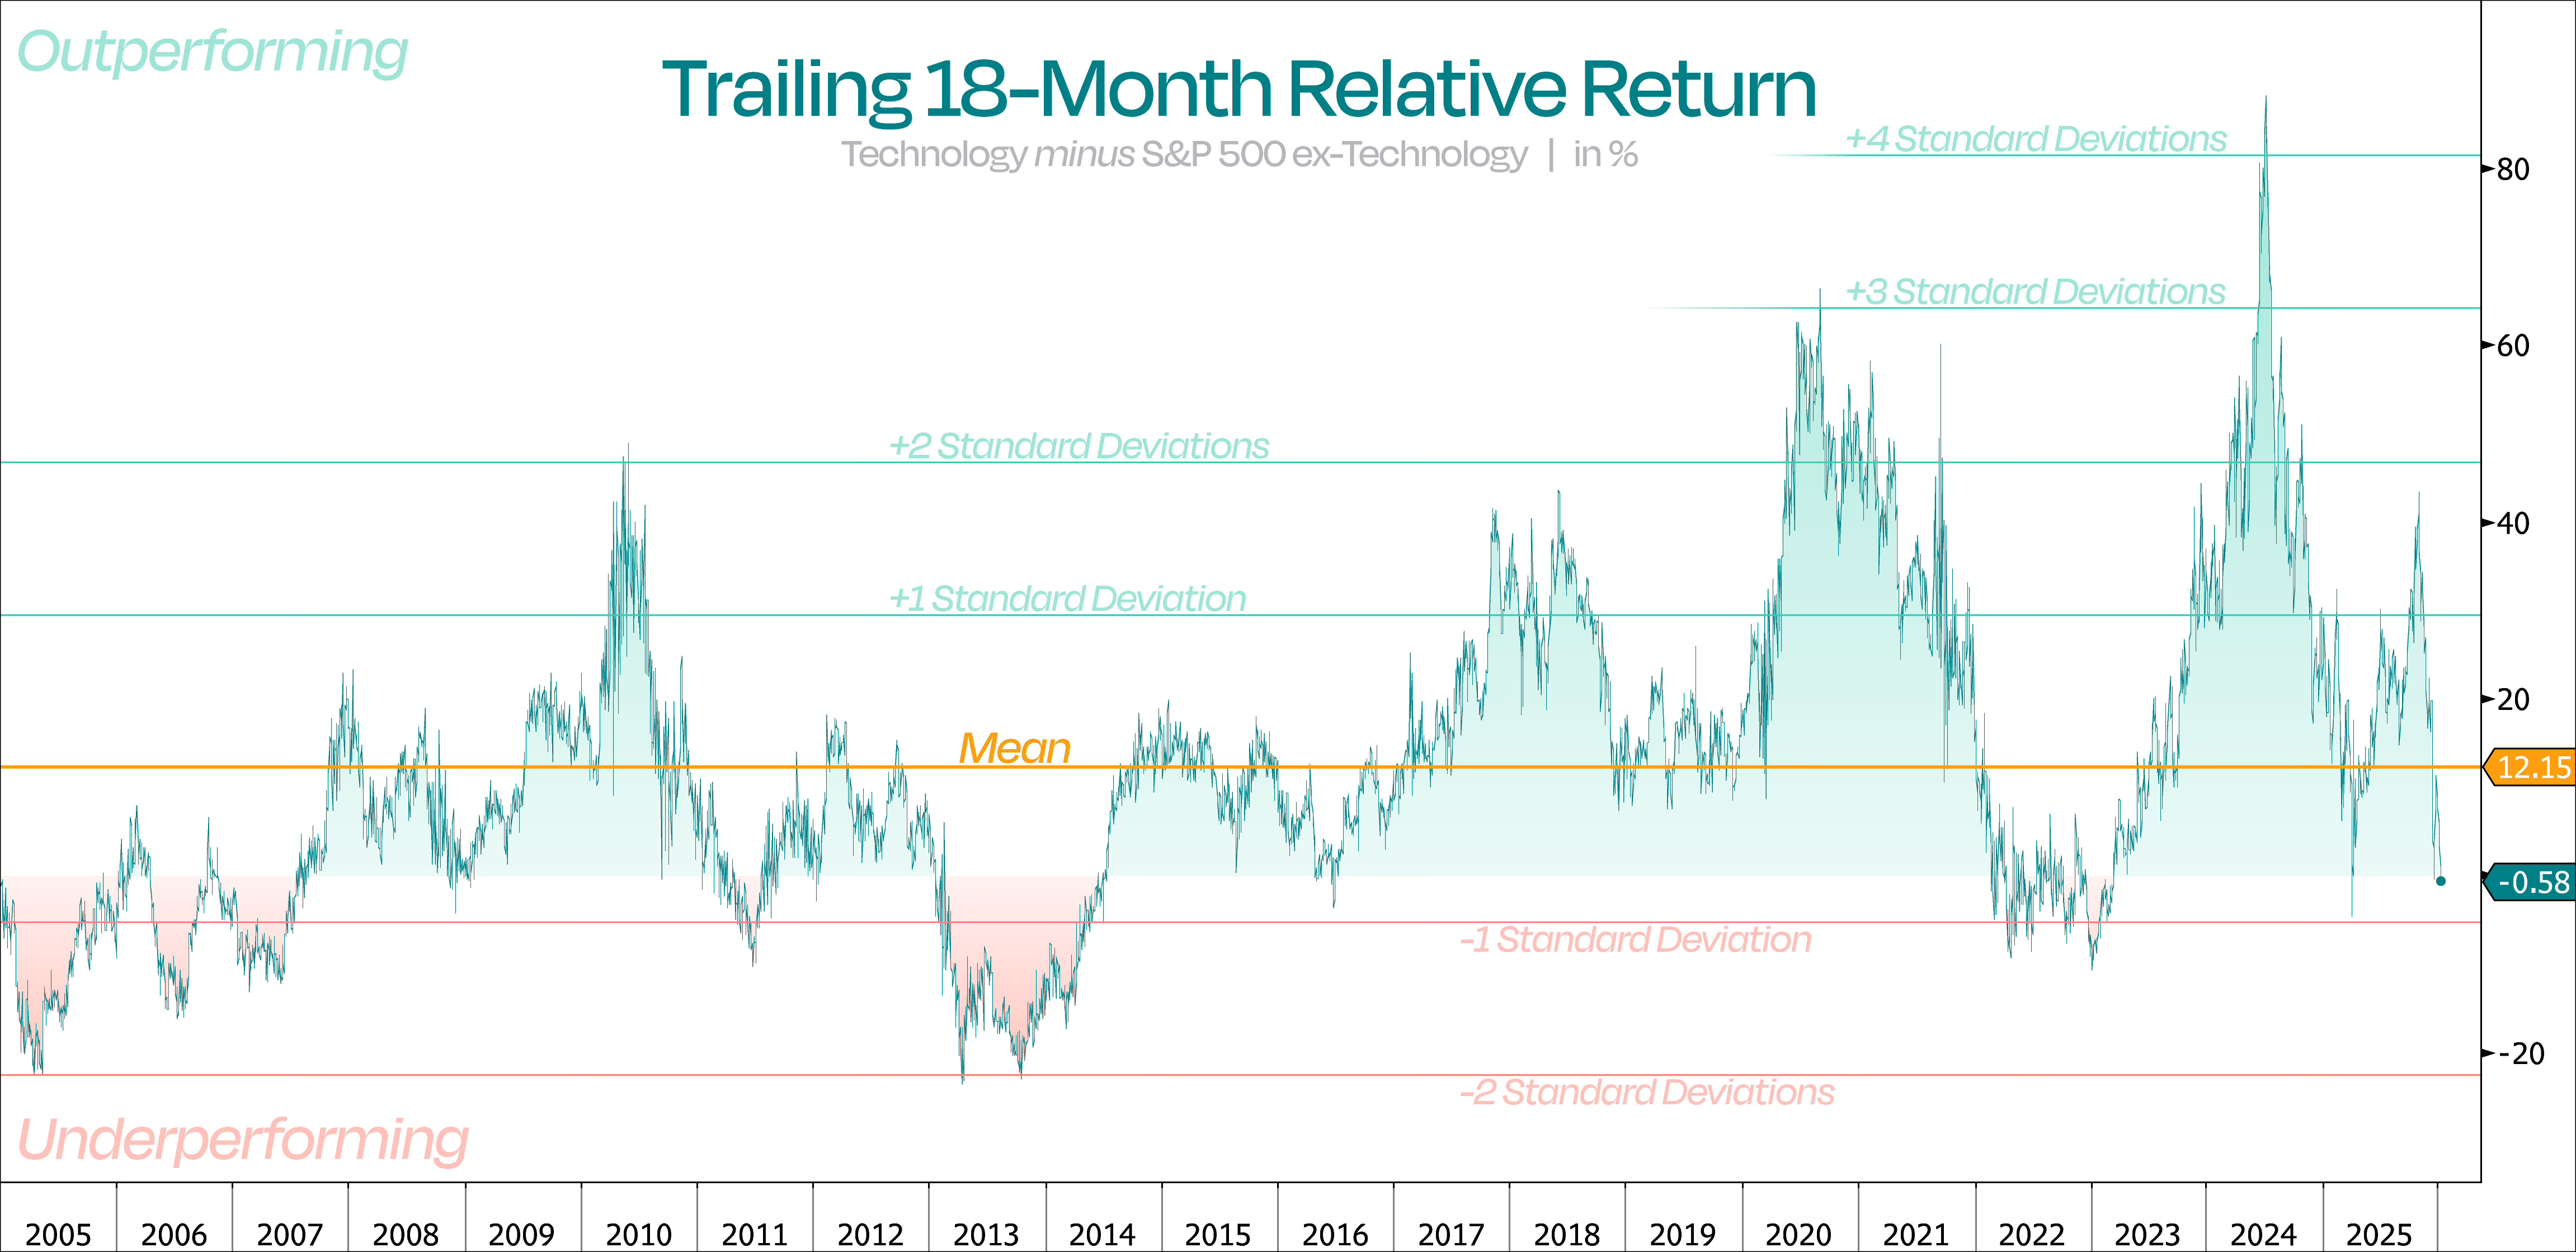
As we said before, Technology has also lagged the broader market over the past 18 months. But over a typical 18-month window, Tech usually outperforms by around 12%.
Right now, relative returns are just below zero — landing in the 30th percentile and close to 1 standard deviation below the long-term mean.
Not excessively oversold, but noteworthy nonetheless — especially in a bull market.
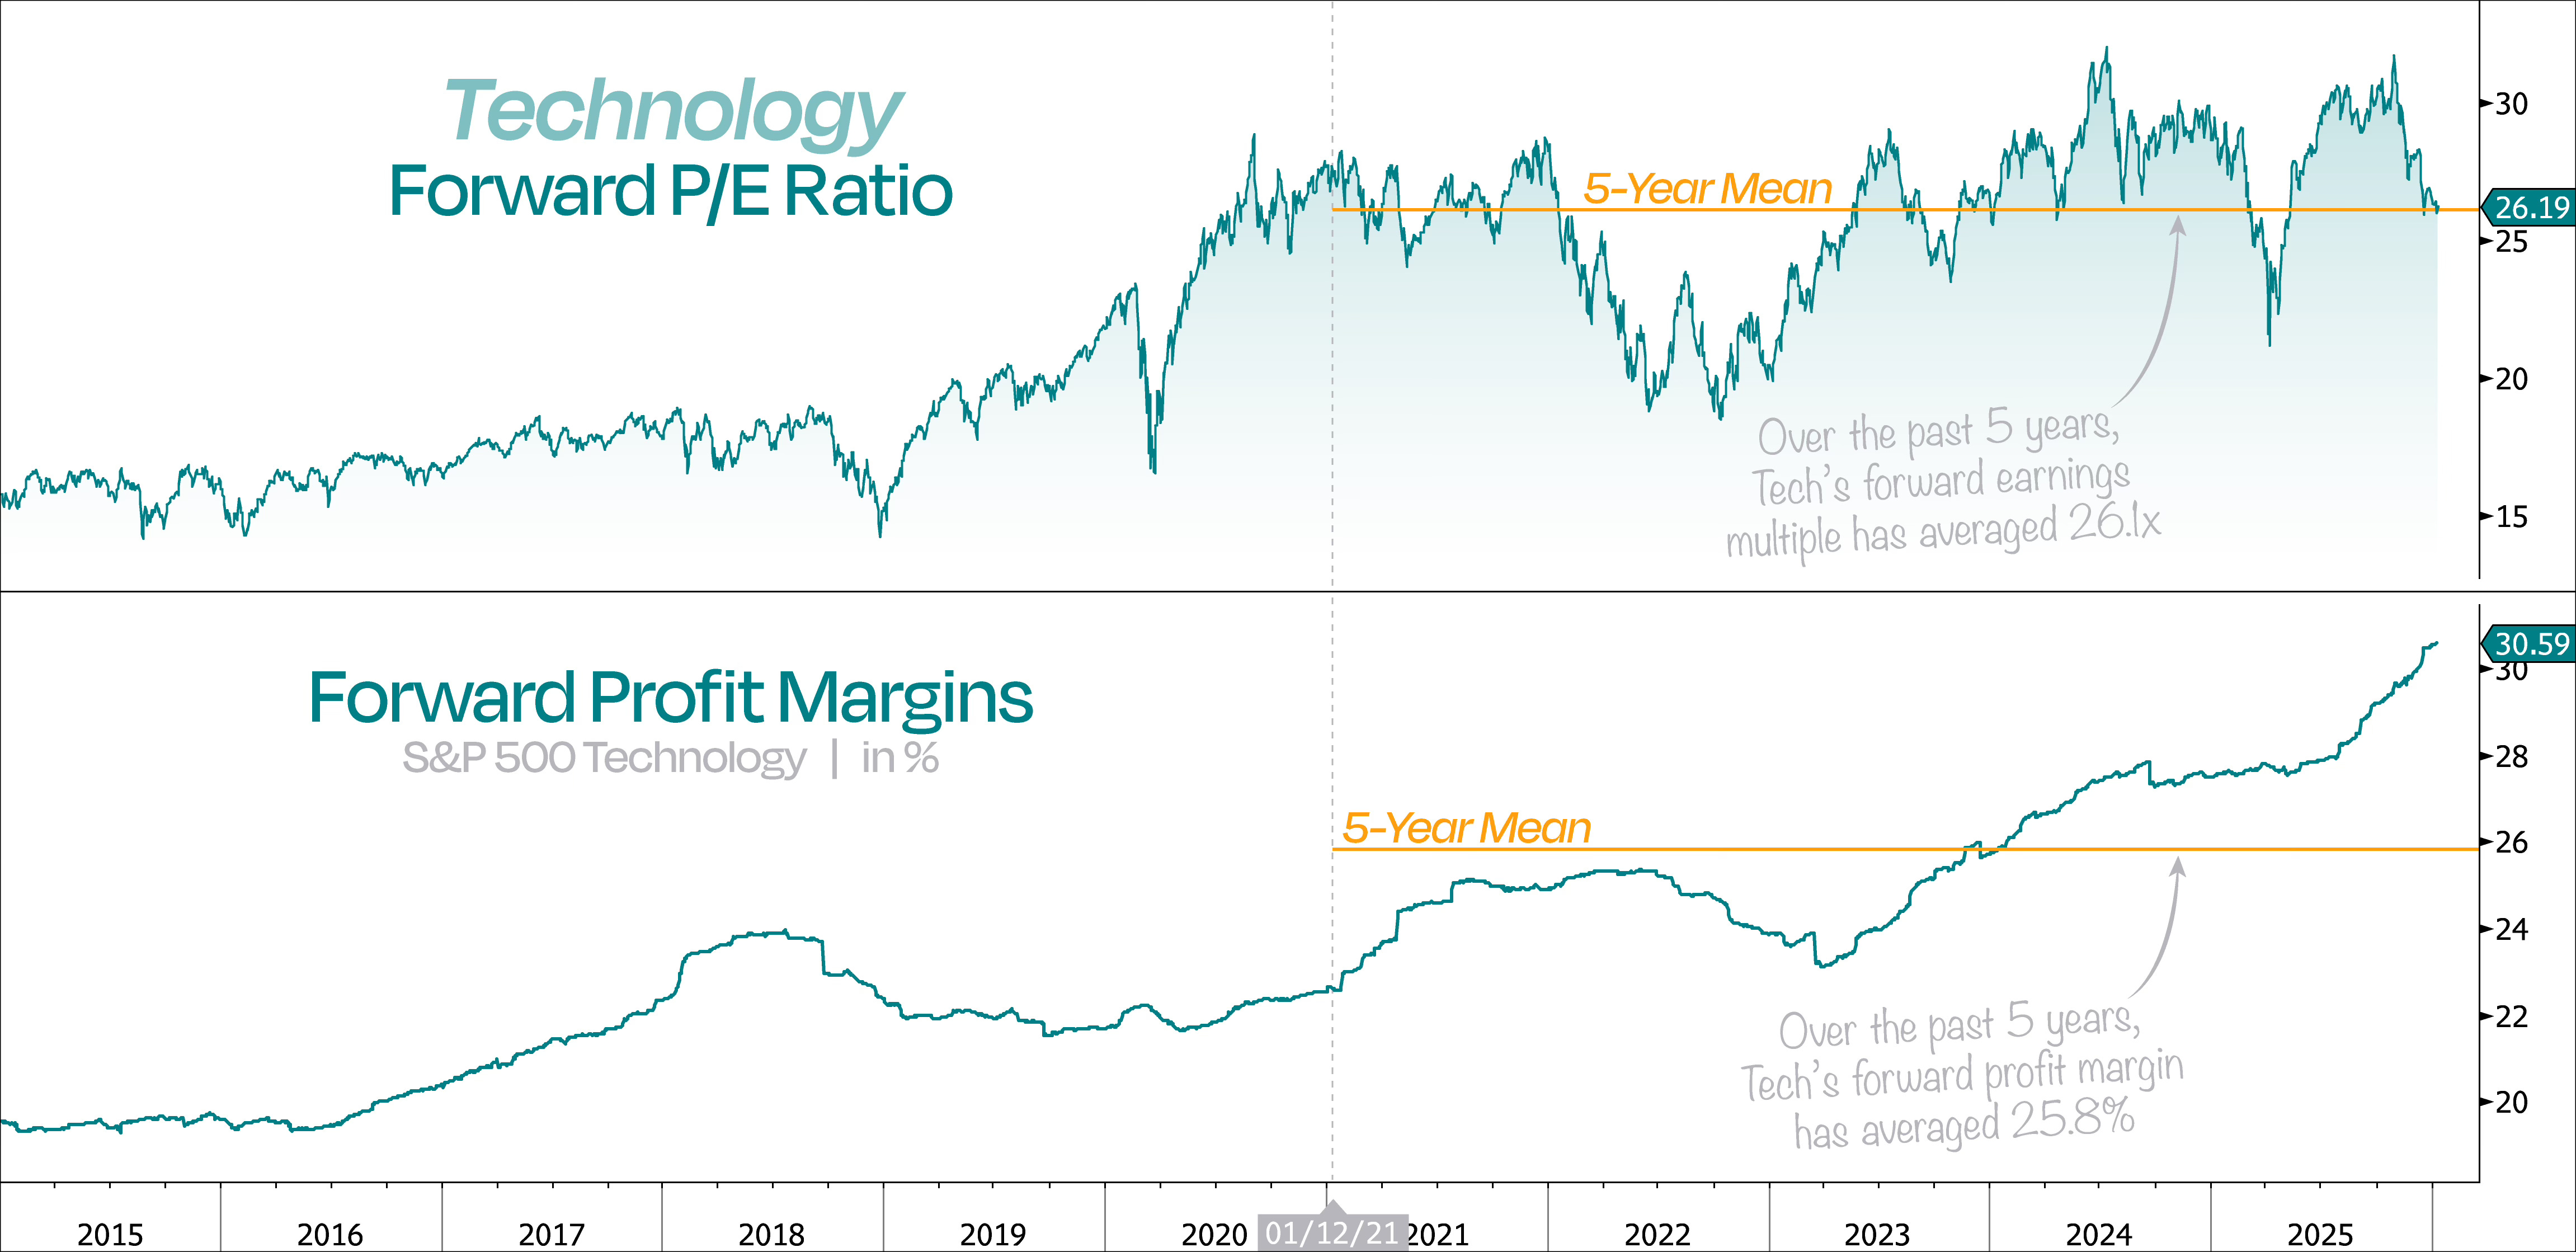
Fortunately, Tech’s recent slump has a silver lining: the sector is looking pretty cheap.
With forward earnings still on the rise, the 6% price drop in Tech has actually translated into almost an 18% contraction in forward P/E multiples.
Right now, the sector trades around 26x next 12-month earnings — right in line with its 5-year average. However, profit margins over the past five years averaged 25.8%, but today they’re closer to 31%.
For us, this really highlights how undemanding Tech is right now — especially given we’re in the middle of the biggest technological revolution in decades.
While valuation obviously isn’t a timing tool for tactical calls, it’s still a tailwind for Tech stocks in this case.
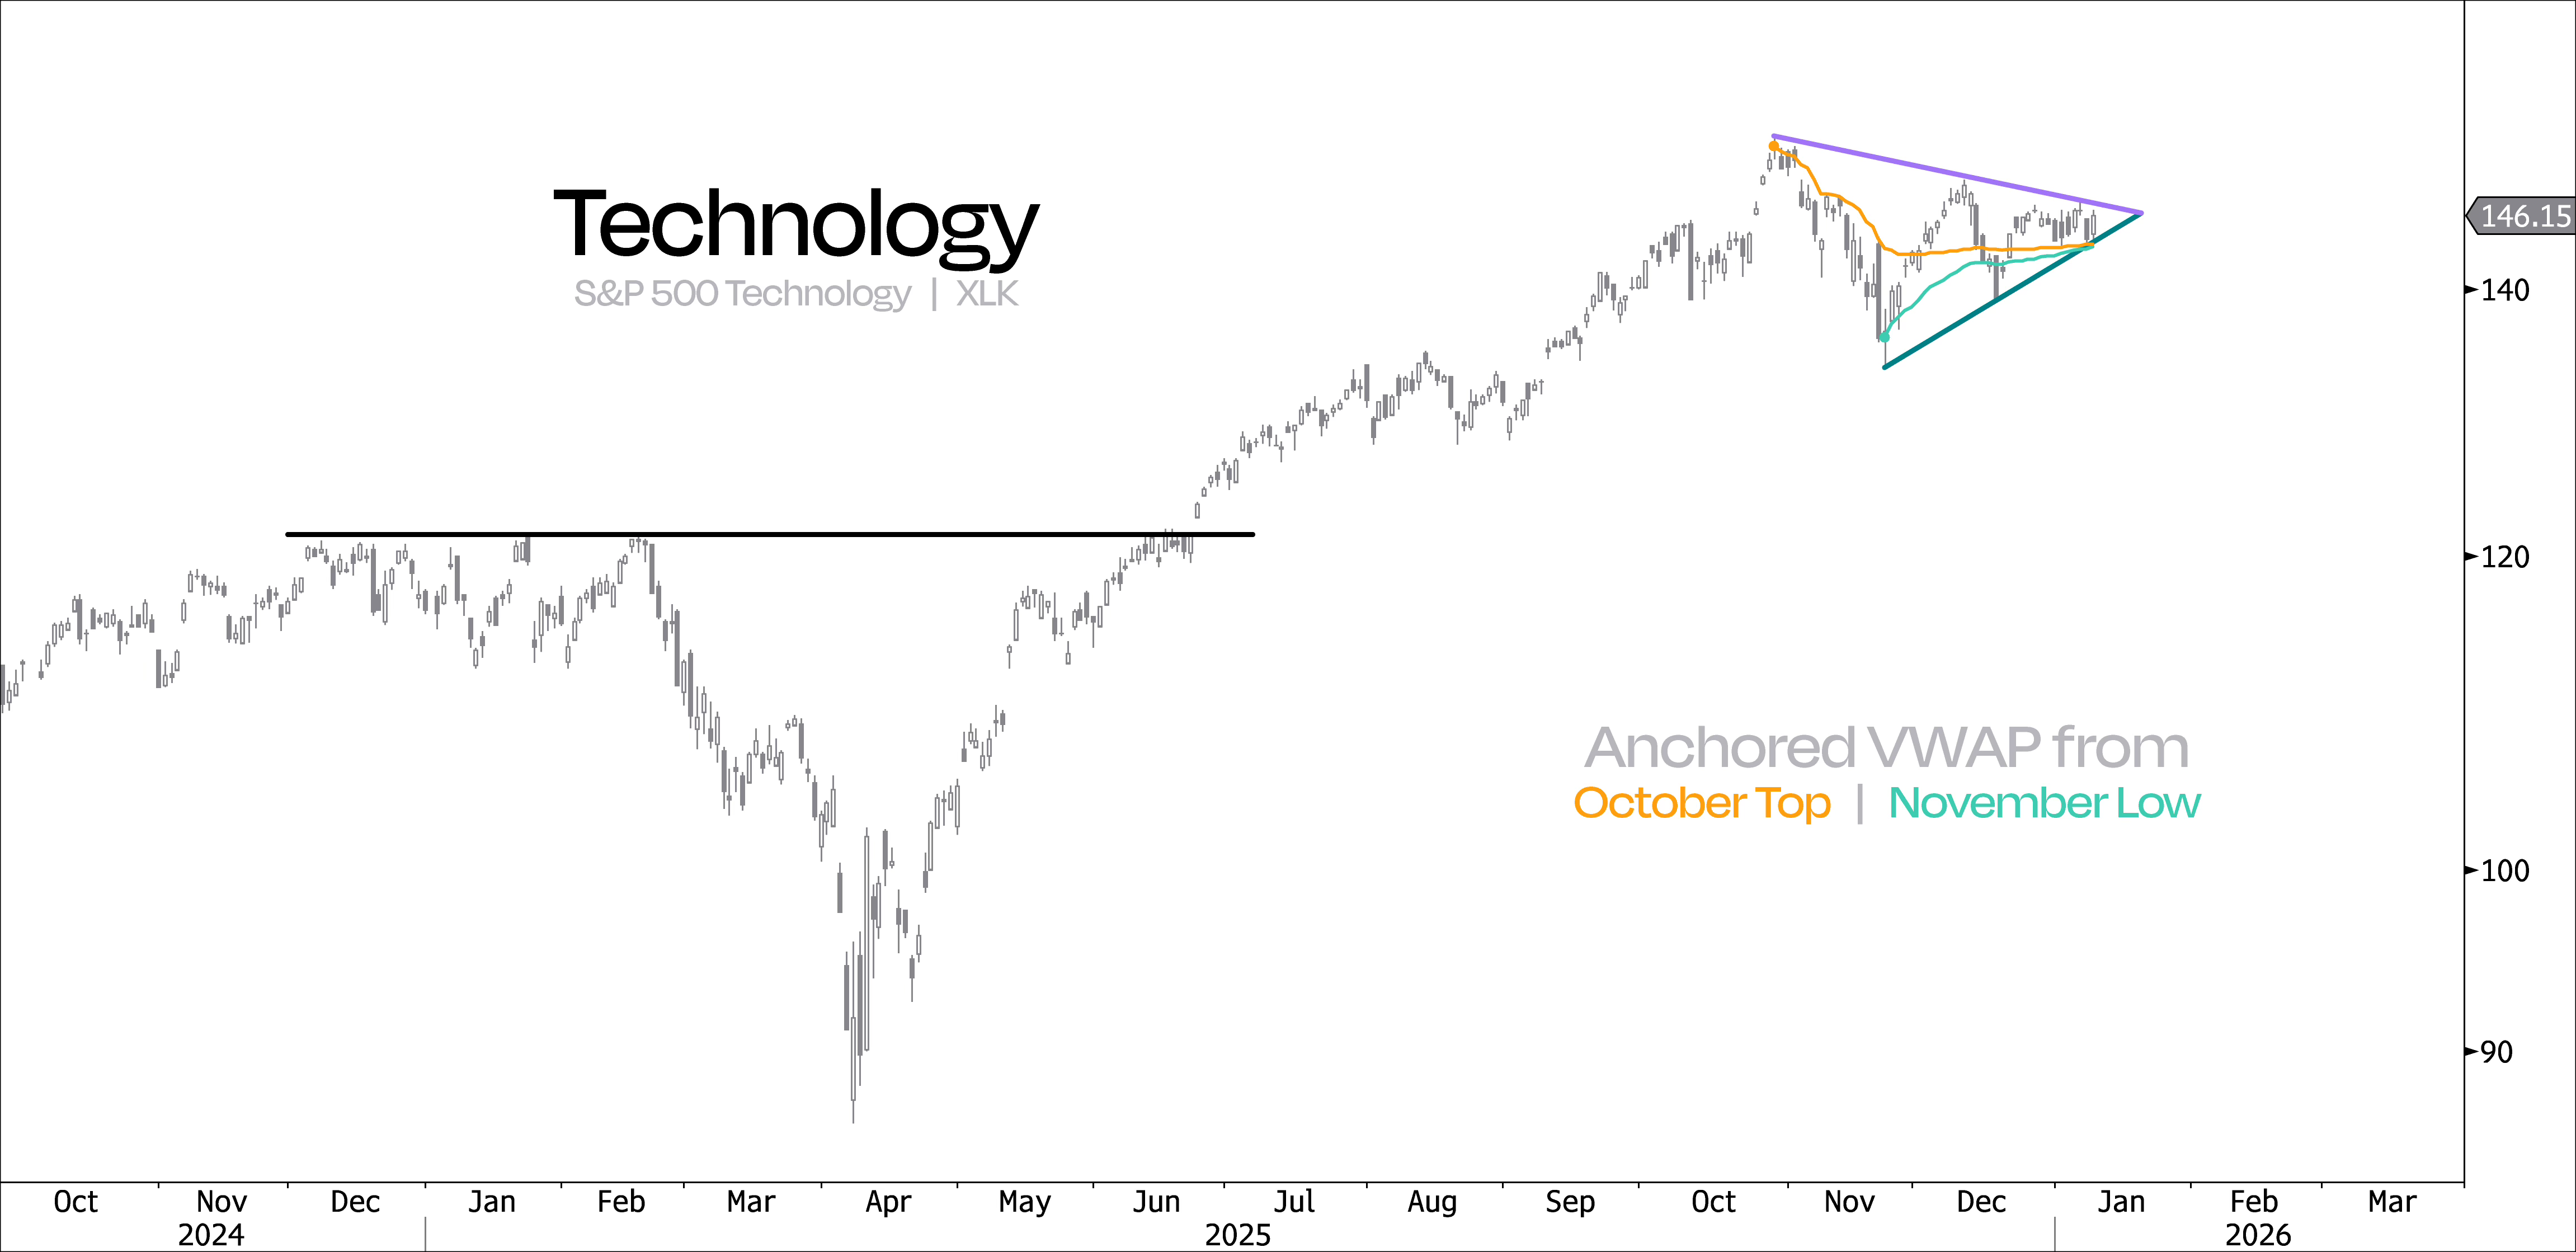
At the end of the day, what will really signal a new momentum wave in Tech after three months of sideways trading is the technical picture.
Right now, there’s a clear symmetrical triangle forming — and it’s getting tight. In other words, a big breakout is coming soon, in one direction or the other.
Given the relative oversold picture we just went through, and the fact that price is holding above all key anchored VWAPs, we’d bet this pattern simply resolves in the direction of the underlying trend — higher.
So, where does that leave us?
We still think most stocks are set up to do well in 2026, but whenever the pendulum swings too far in one direction, a swing back usually follows.
For us, the cleansing of the AI trade since October sets the stage for a tactical bounce:
Tech is meaningfully oversold relative to the rest of the market
Institutions have been buying everything except Tech
Investors have already bought downside protection in Tech names
And Tech valuations can expand as earnings keep moving higher
That said, we’d be careful about going too light on Tech, since the odds of a tactical bounce are pretty high.
Plus, let’s not forget one thing — Tech still drives this bull market. It’s what has been driving earnings, it’s what has been lifting margins, and it’s ultimately what has allowed the S&P 500 to trade at elevated multiples.
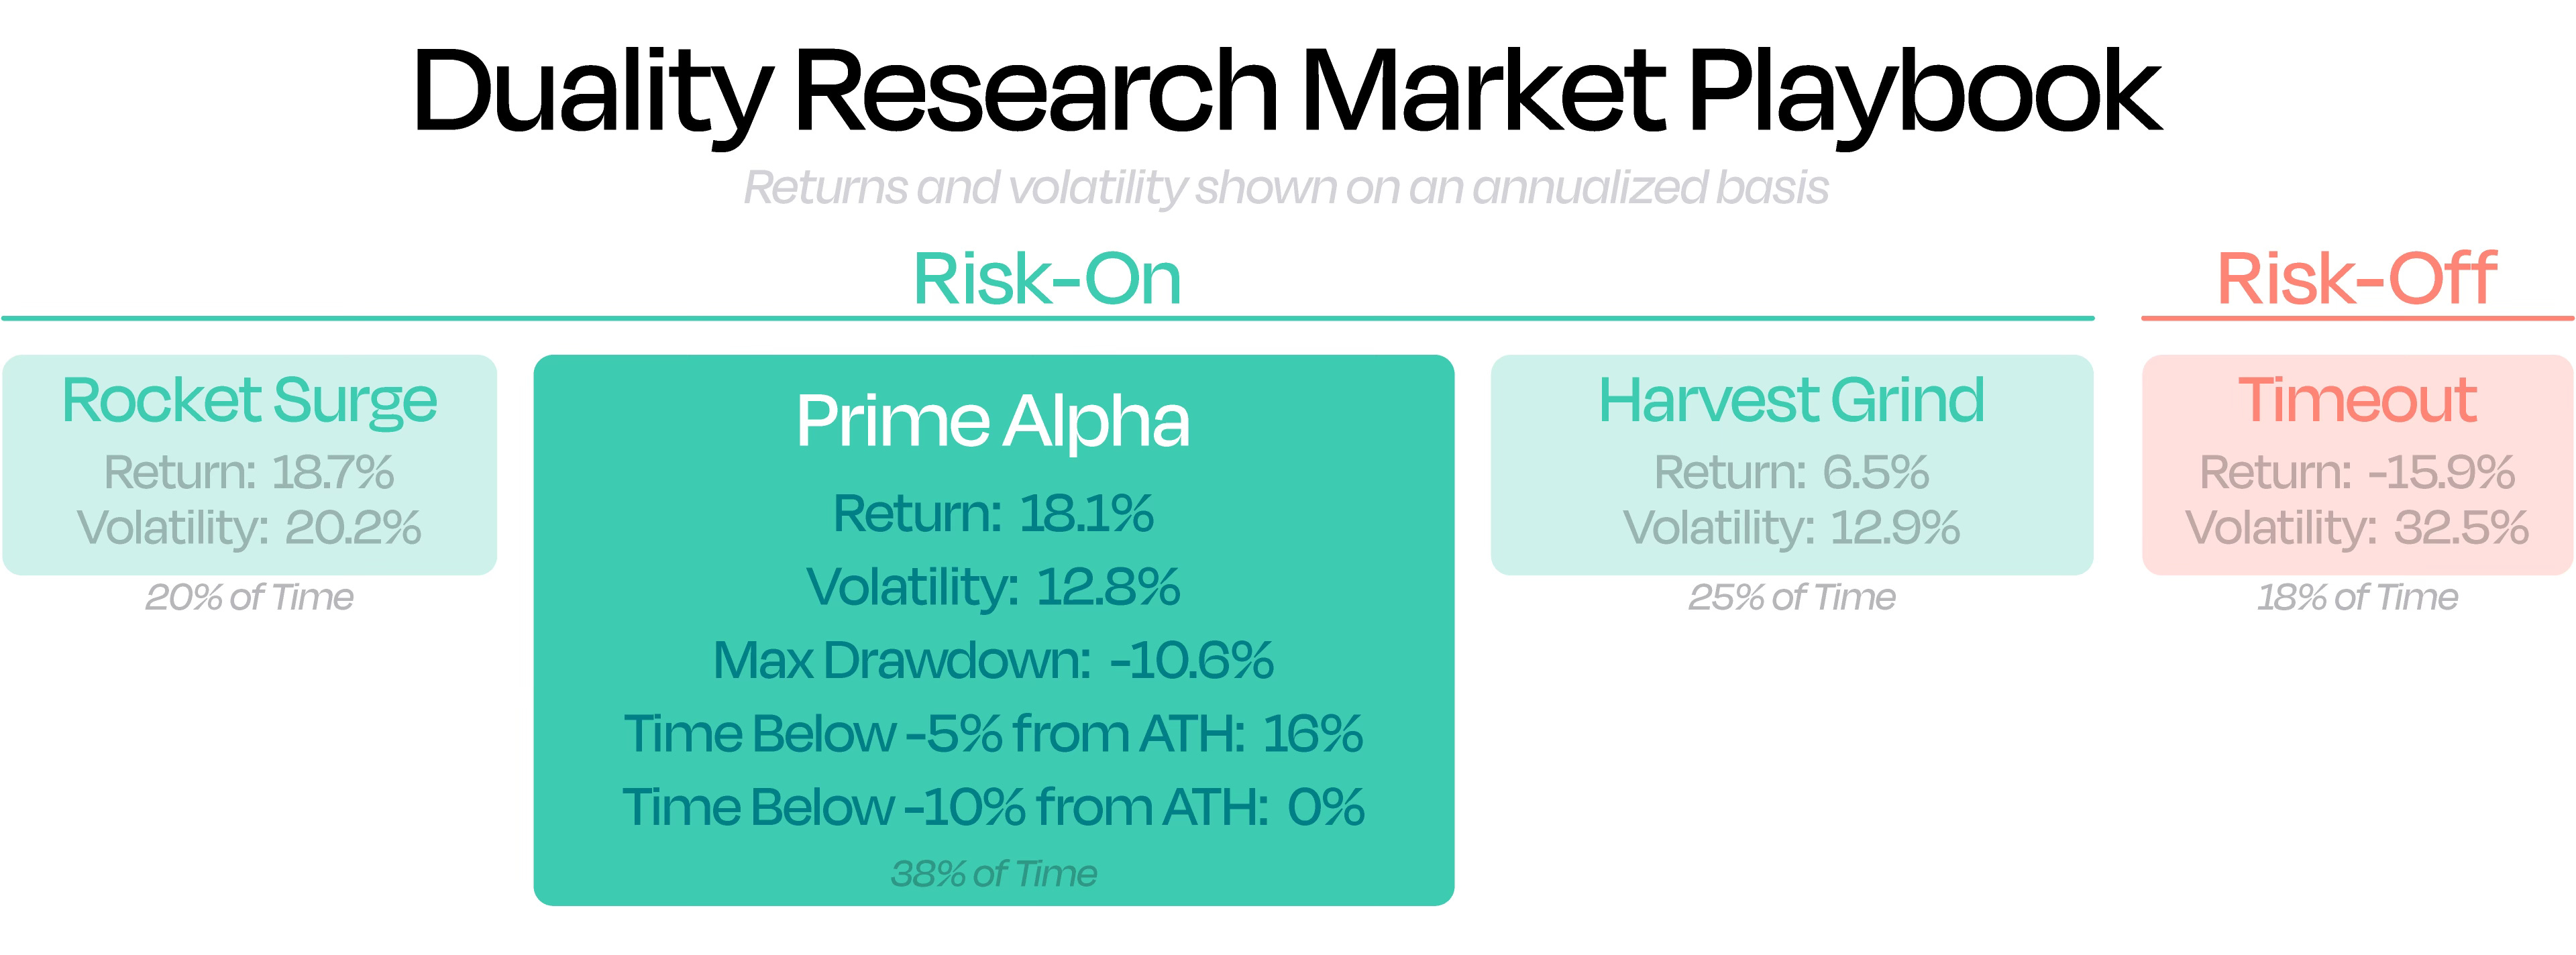
♟️ Duality Research Market Playbookdual
Breadth Thrust Regime ✅ — Proprietary Model ✅
With a Breadth Thrust Regime in place and our Proprietary Model firmly in risk-on territory, we remain in the Prime Alpha stage of our Market Playbook.
More than 2× the performance of a buy-and-hold S&P 500 approach
3× stronger risk-adjusted returns than simply holding the S&P 500
S&P 500 stays within 5% of record highs 84% of the time

Keep reading with a 7-day free trial
Subscribe to Duality Research to keep reading this post and get 7 days of free access to the full post archives.