
💸 CPI – February
MacroDrip

The inflation print for February just hit the tape, so let’s dive right in!
Here are the headline prints:
Year-over-Year:
✅ *US FEBRUARY CPI RISES 2.4% Y/Y; EST. +2.4%
✅ *US FEBRUARY CORE CPI RISES 2.5% Y/Y; EST. +2.5%
Month-over-Month:
✅ *US FEBRUARY CPI RISES 0.3% M/M; EST. +0.3%
✅ *US FEBRUARY CORE CPI RISES 0.2% M/M; EST. +0.2%
For a complete breakdown of last month’s CPI,
download our US Inflation Dashboard.

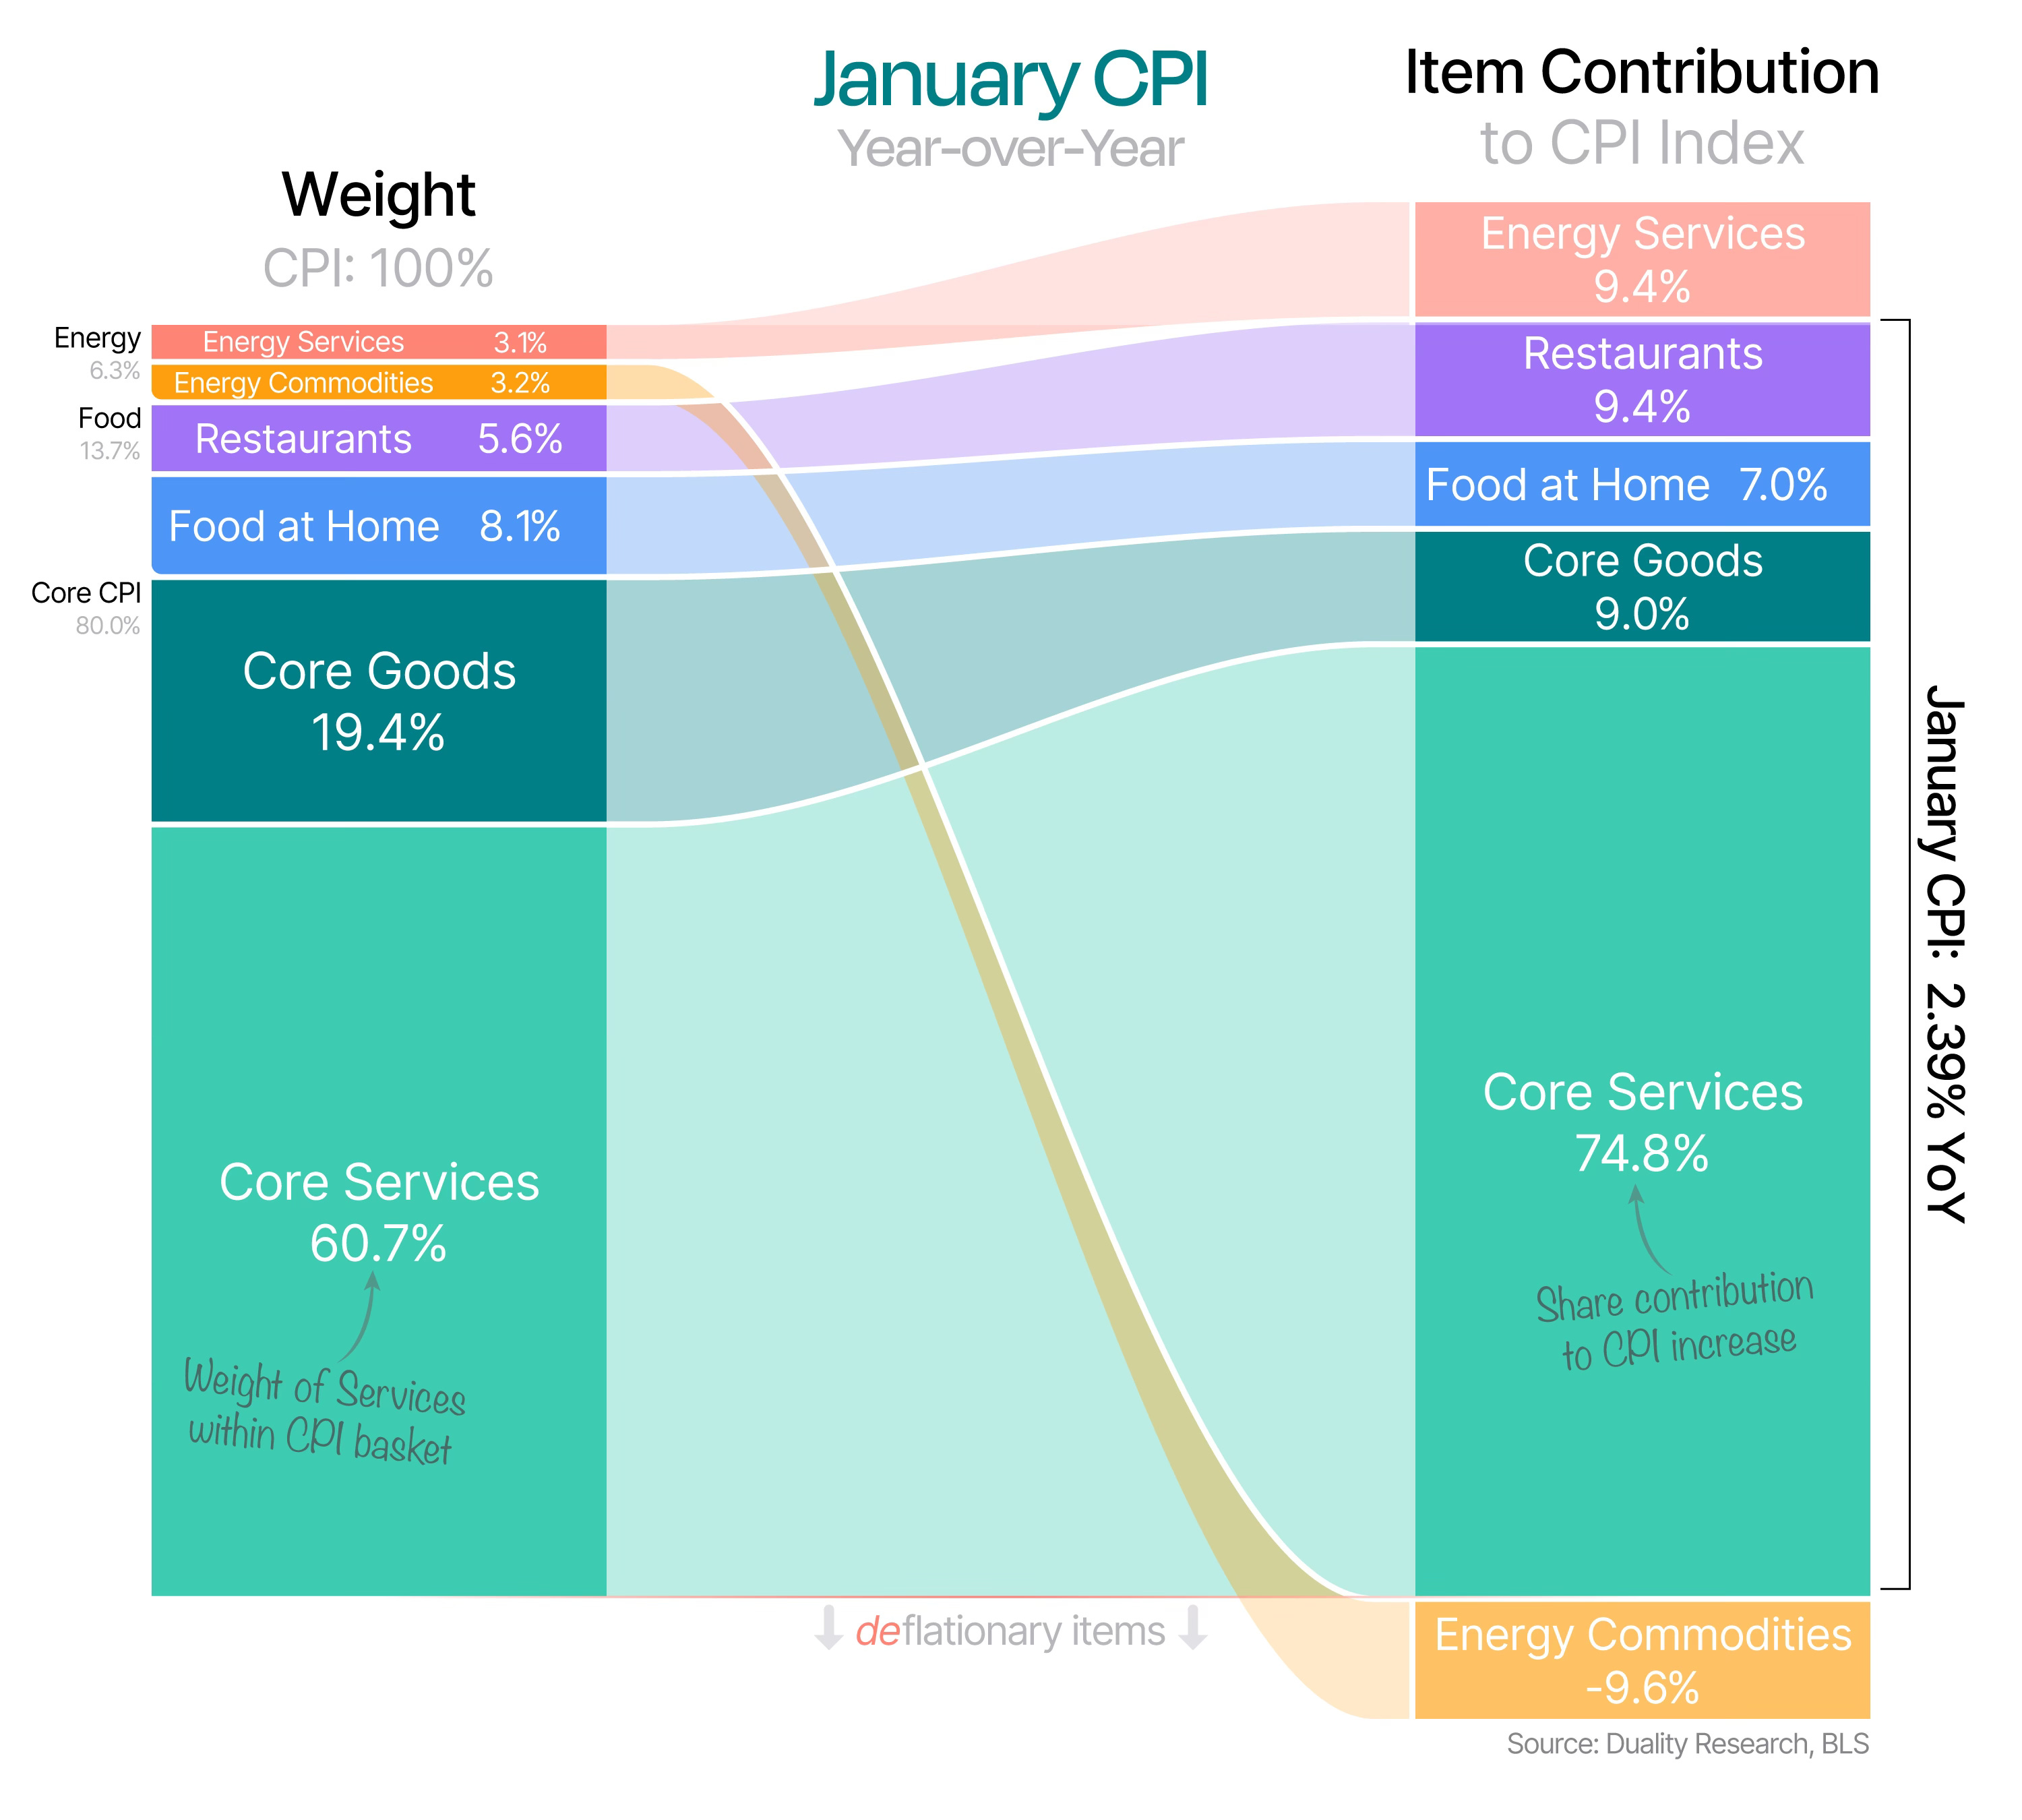
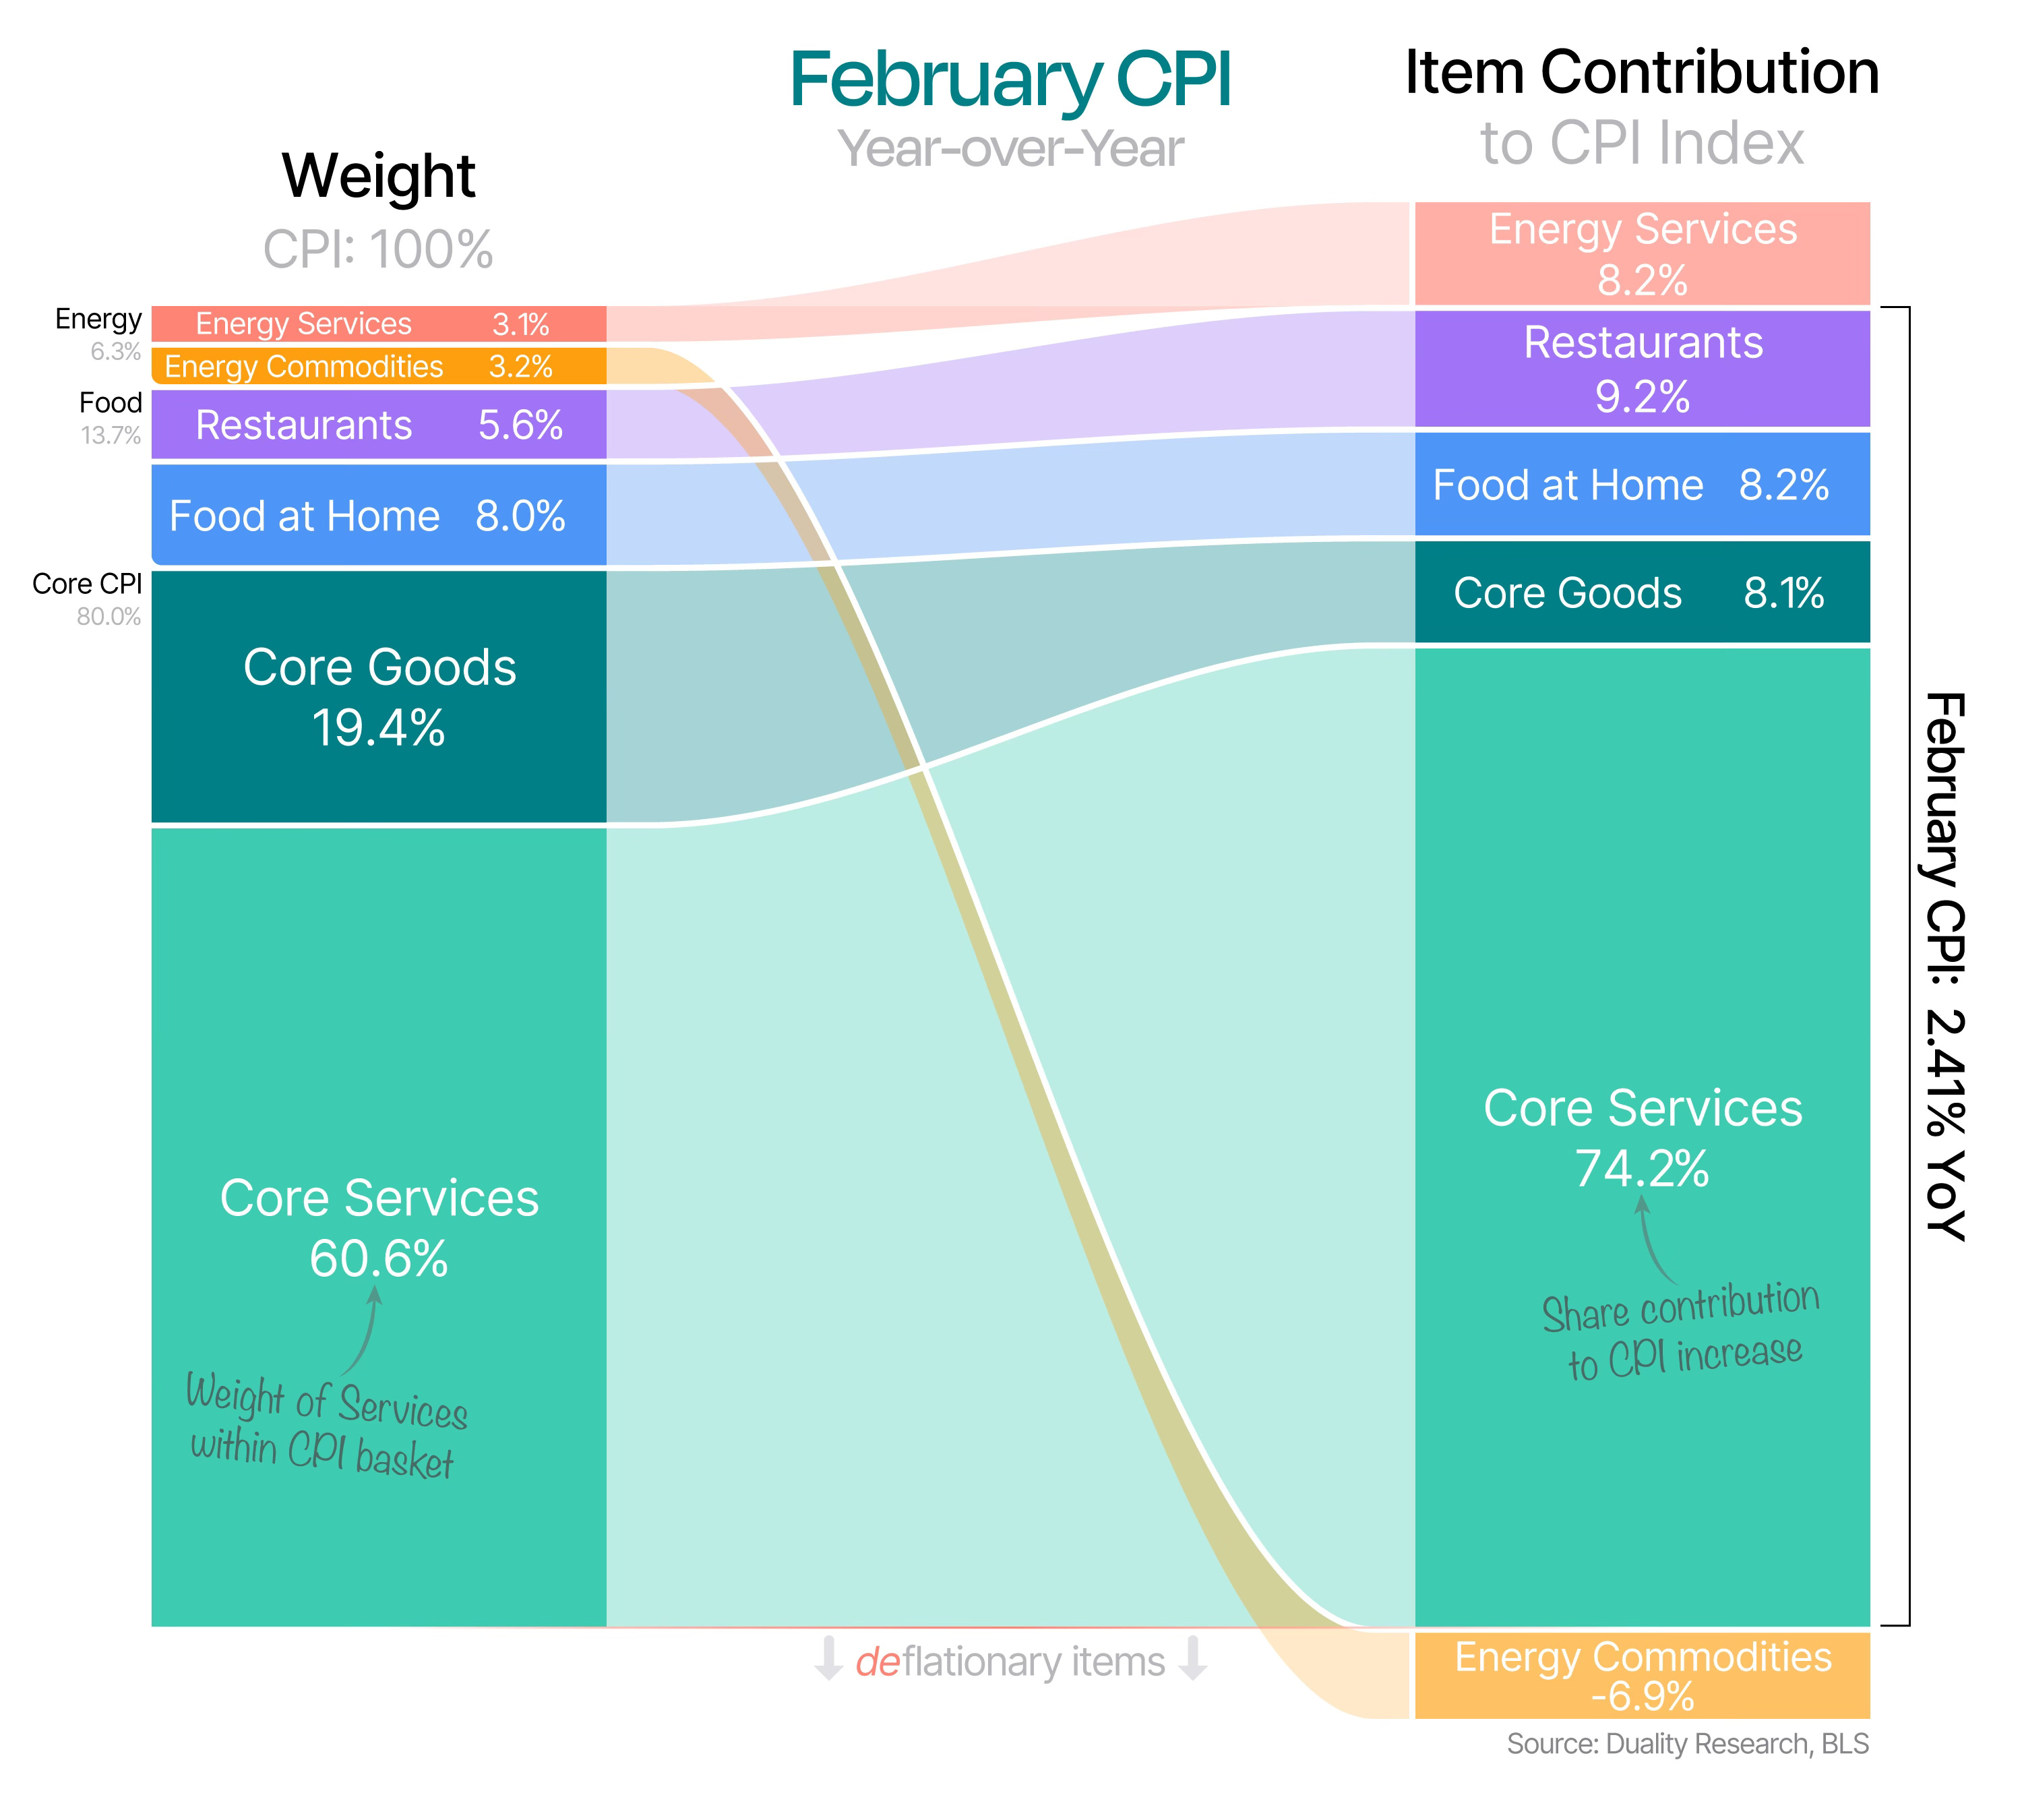
February CPI — Year-over-Year
Let’s start with our chart that shows the weight of the three main CPI categories and their respective sub-groups on the left. On the right, you can see how each item contributes to the overall index.
(see January CPI)
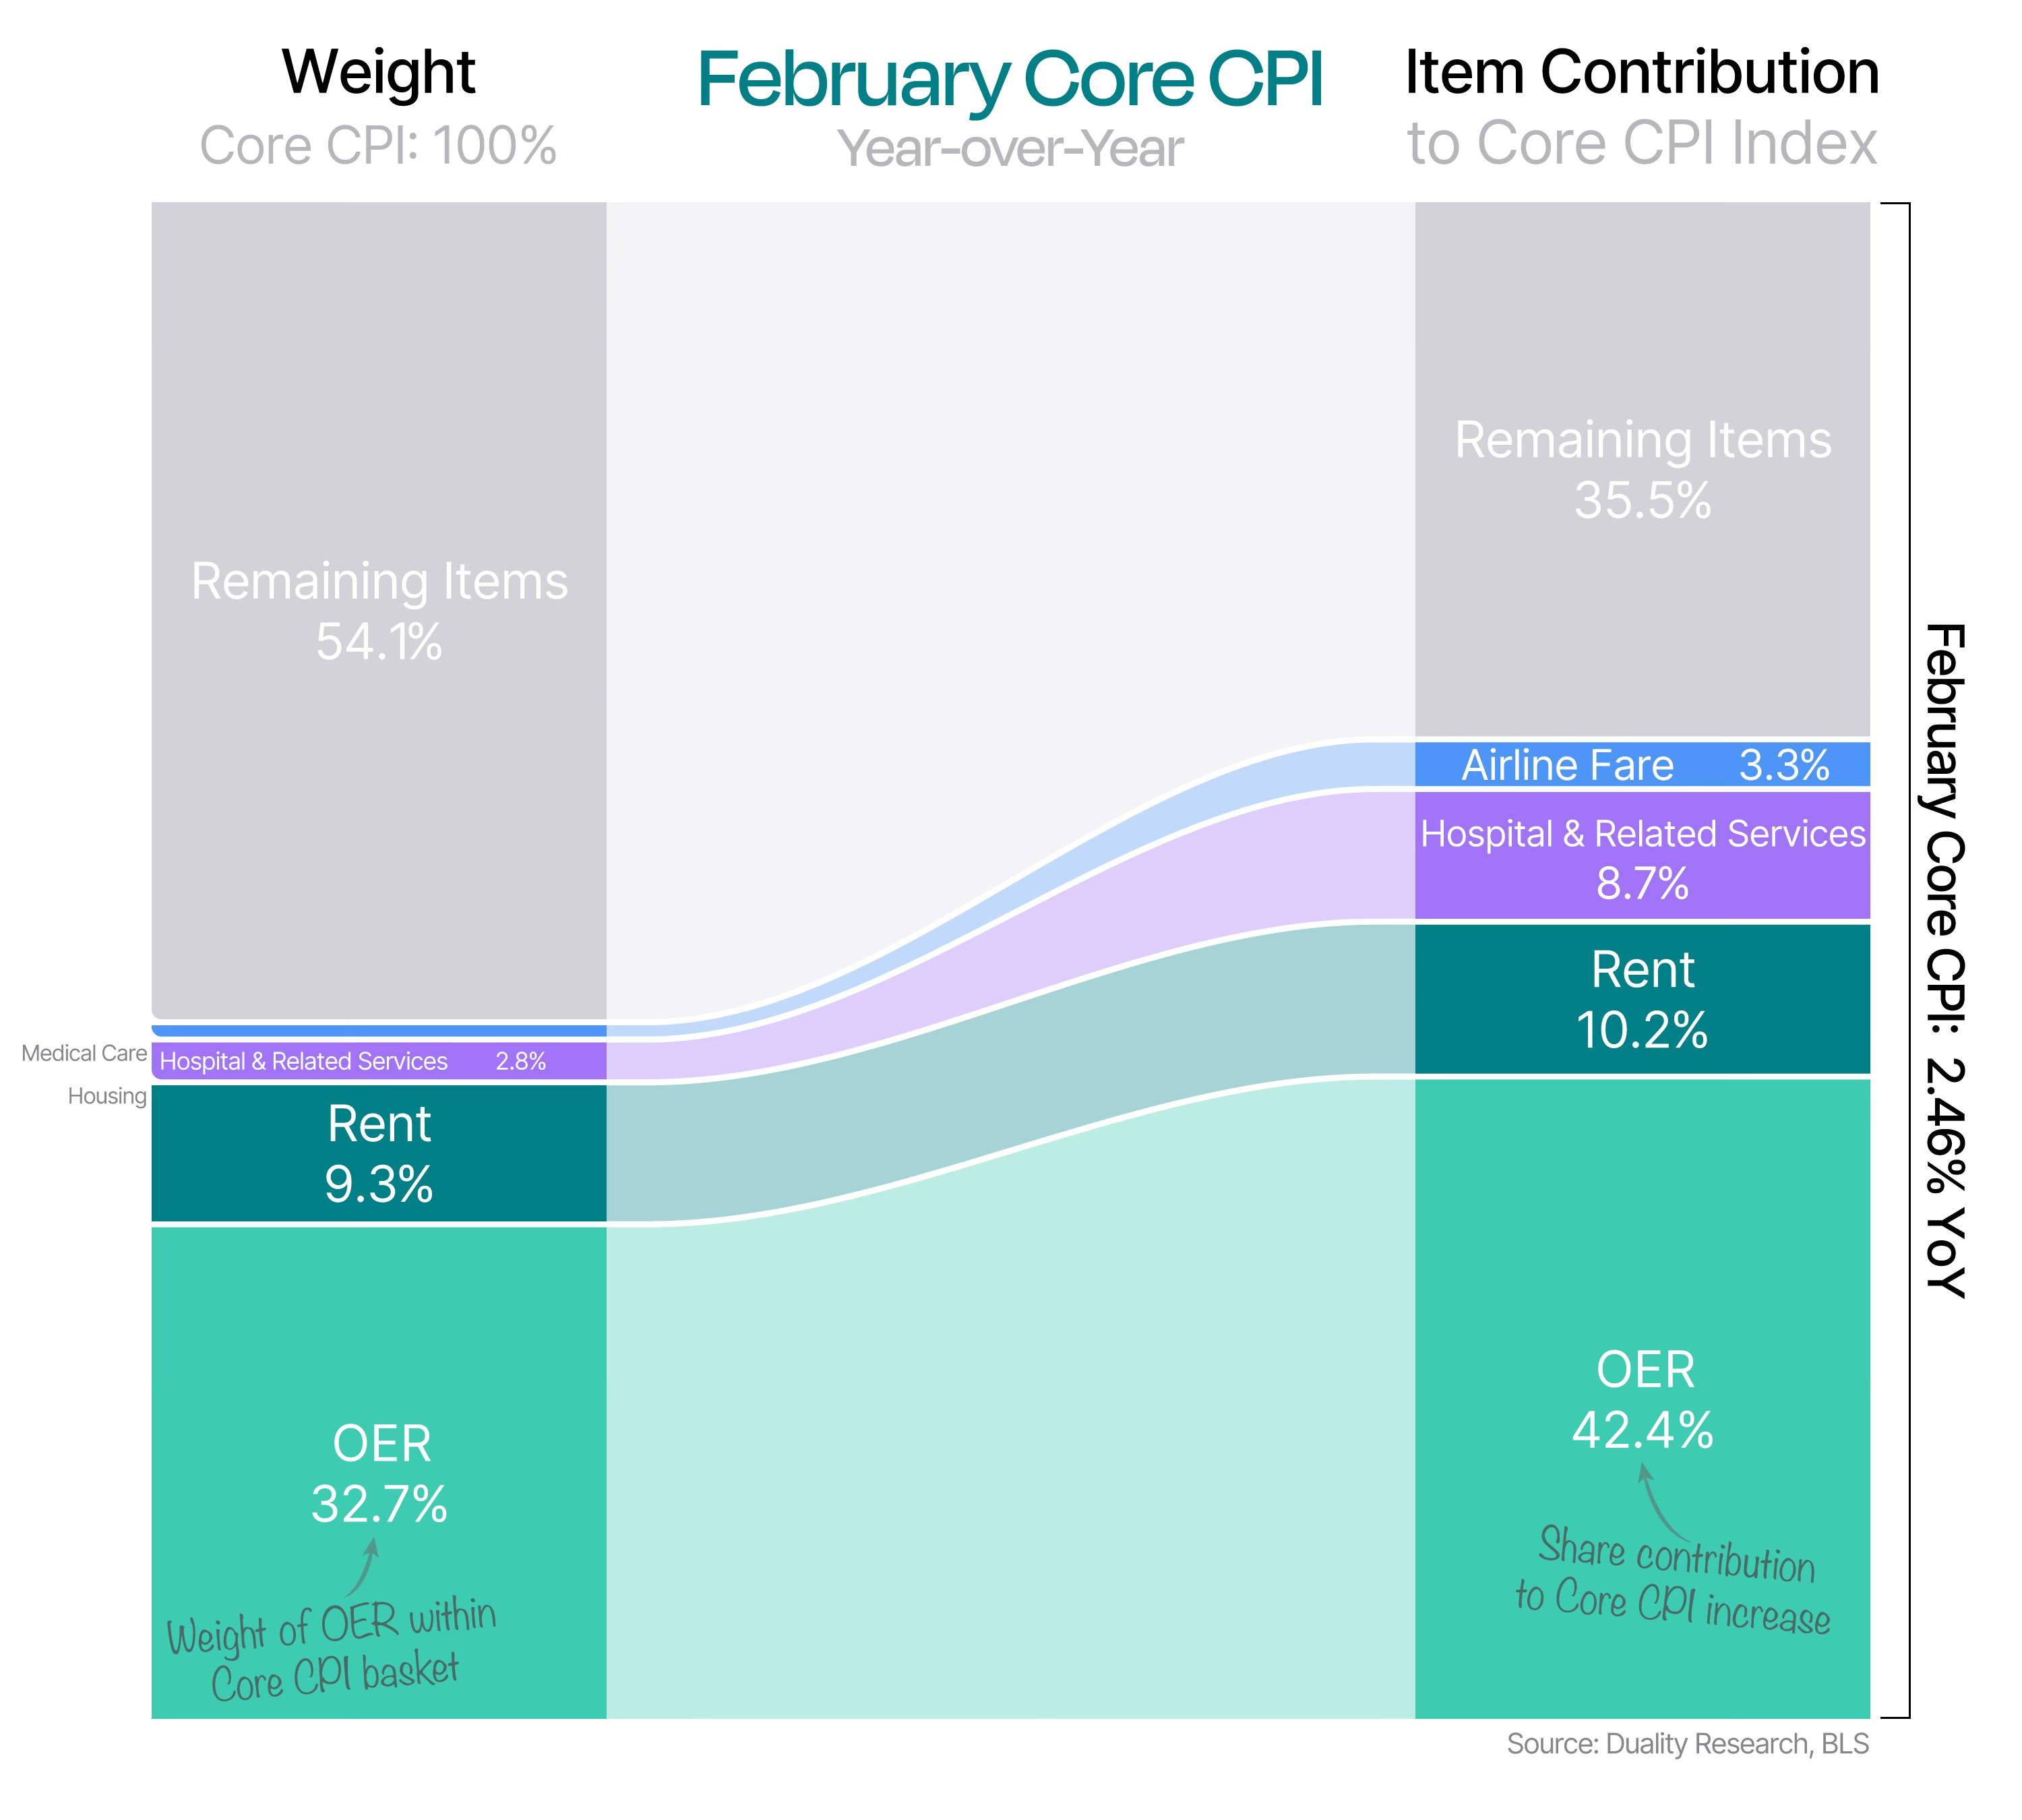
Next up, we’ve got two charts breaking down Core CPI — one showing year-over-year (YoY) changes and the other highlighting month-over-month (MoM) shifts, focusing on items with the most disproportionate impact.
February Core CPI — Year-over-Year
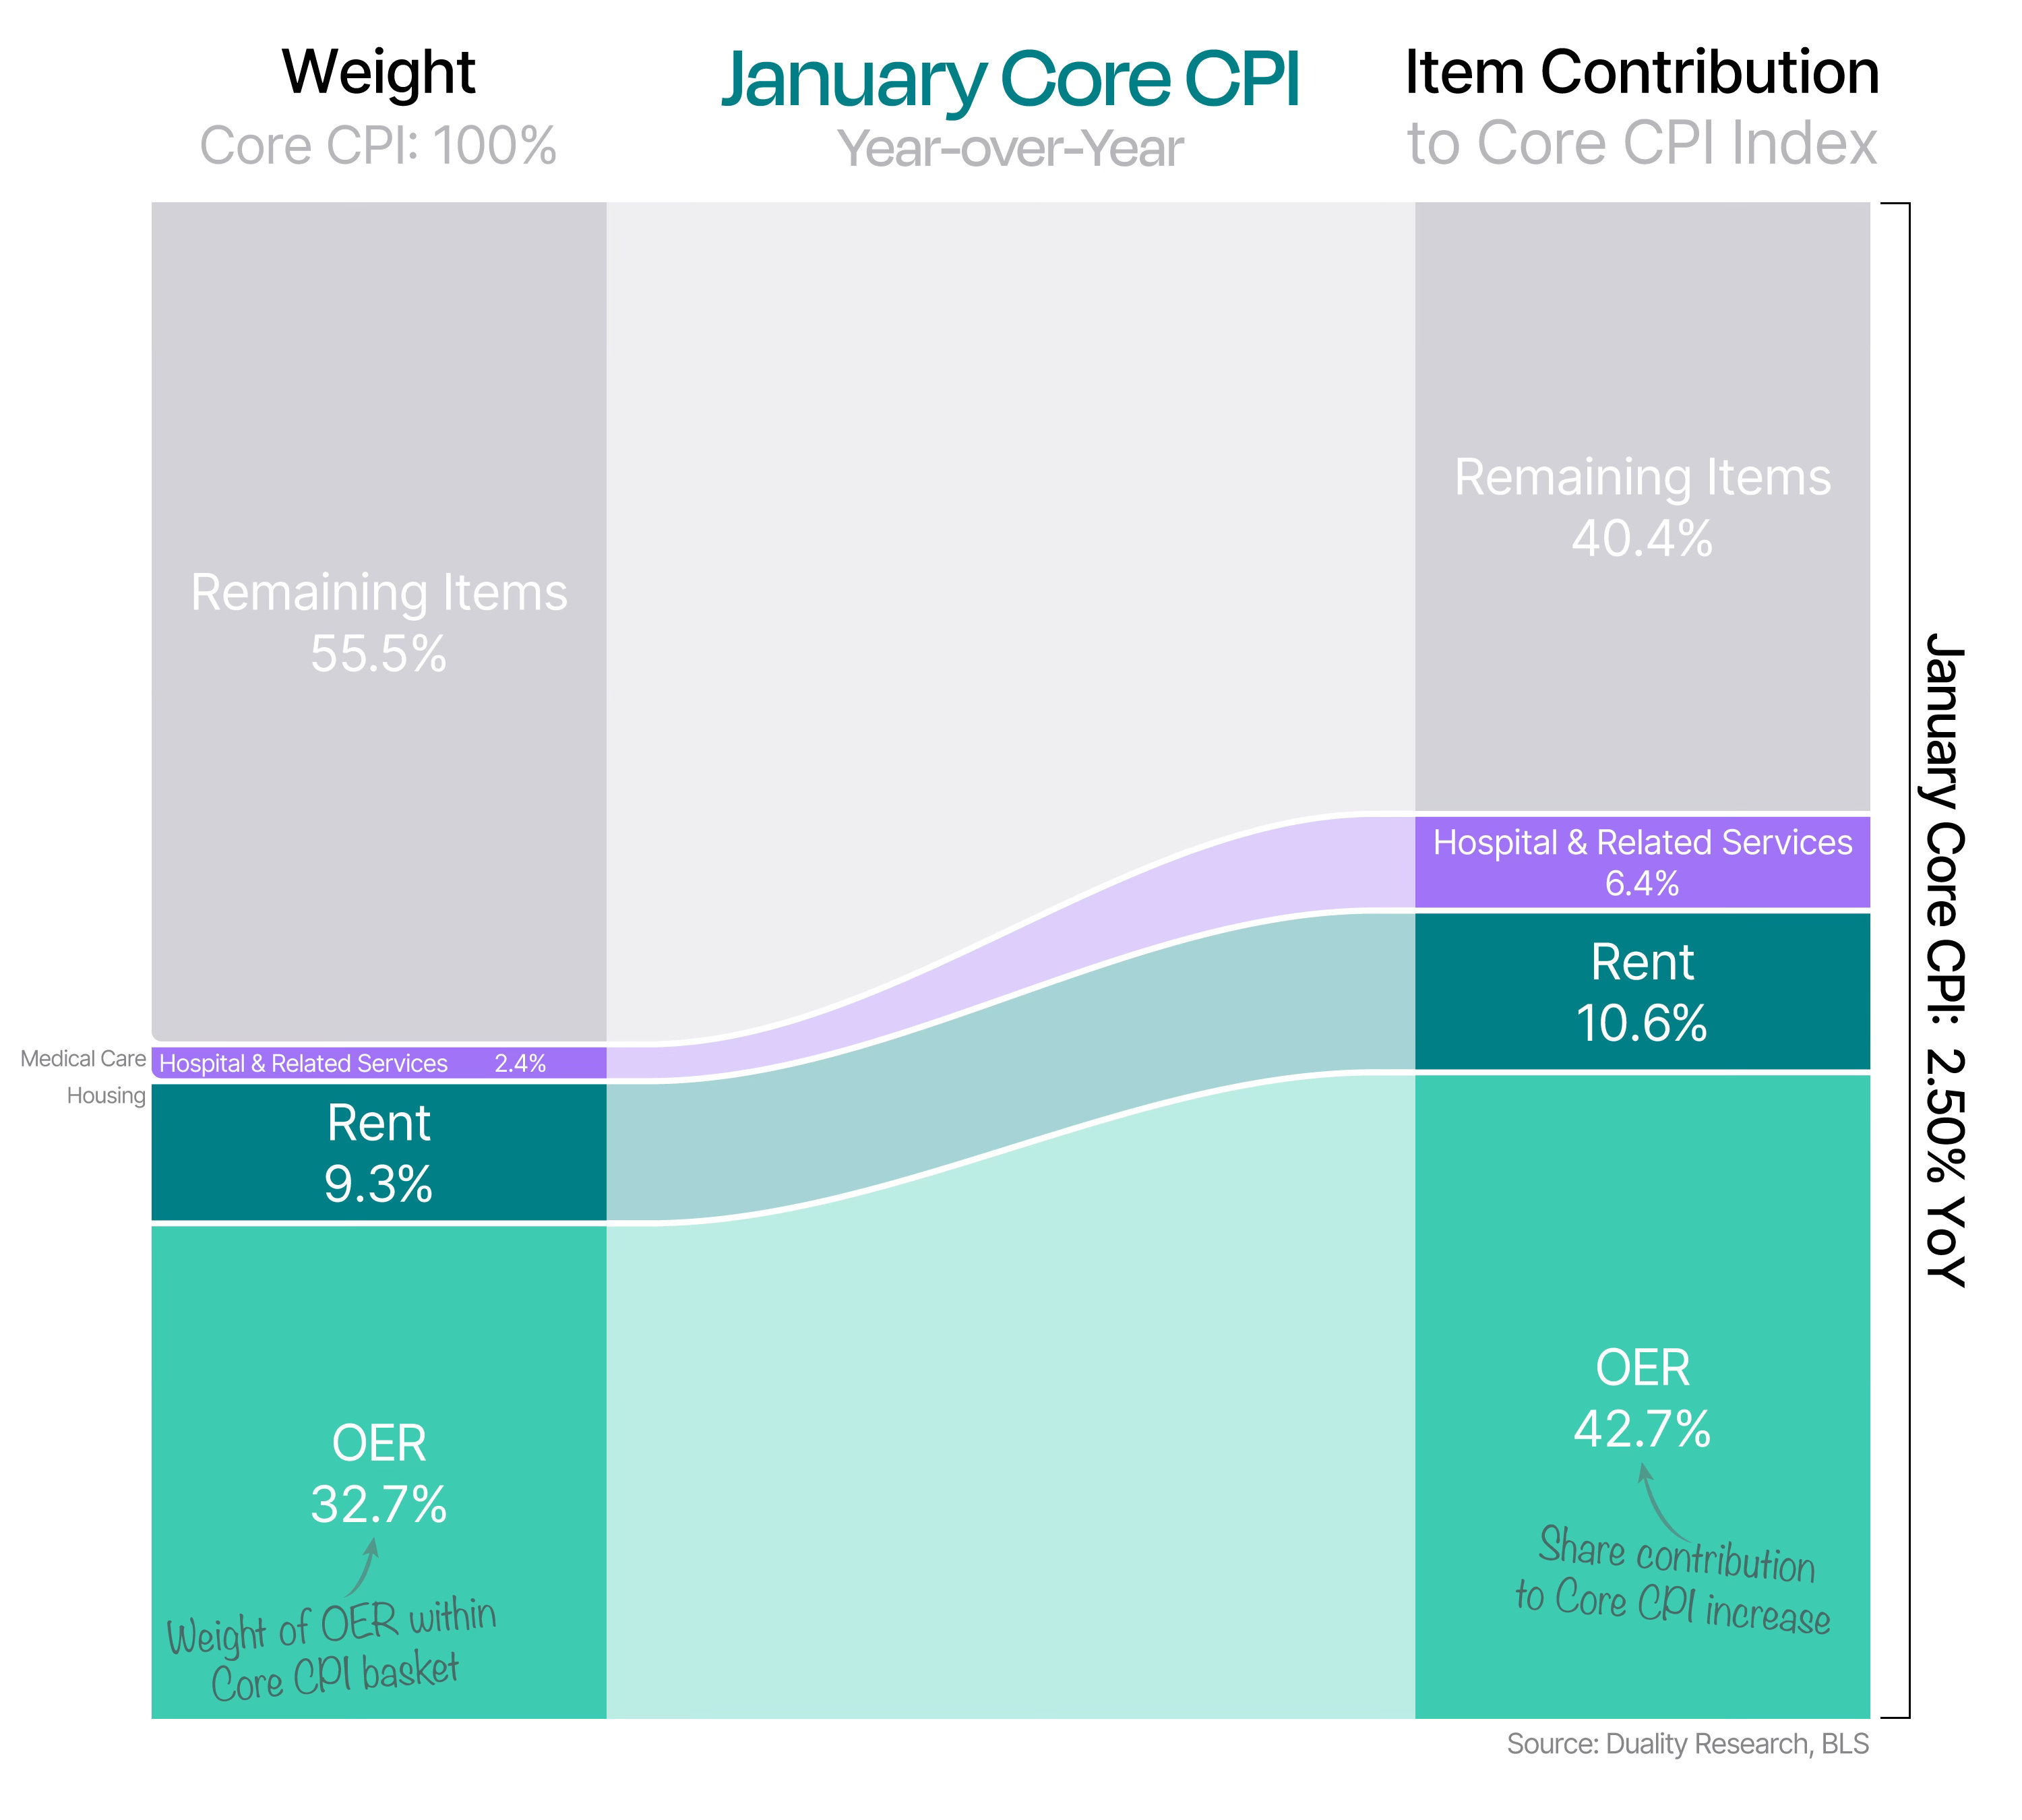
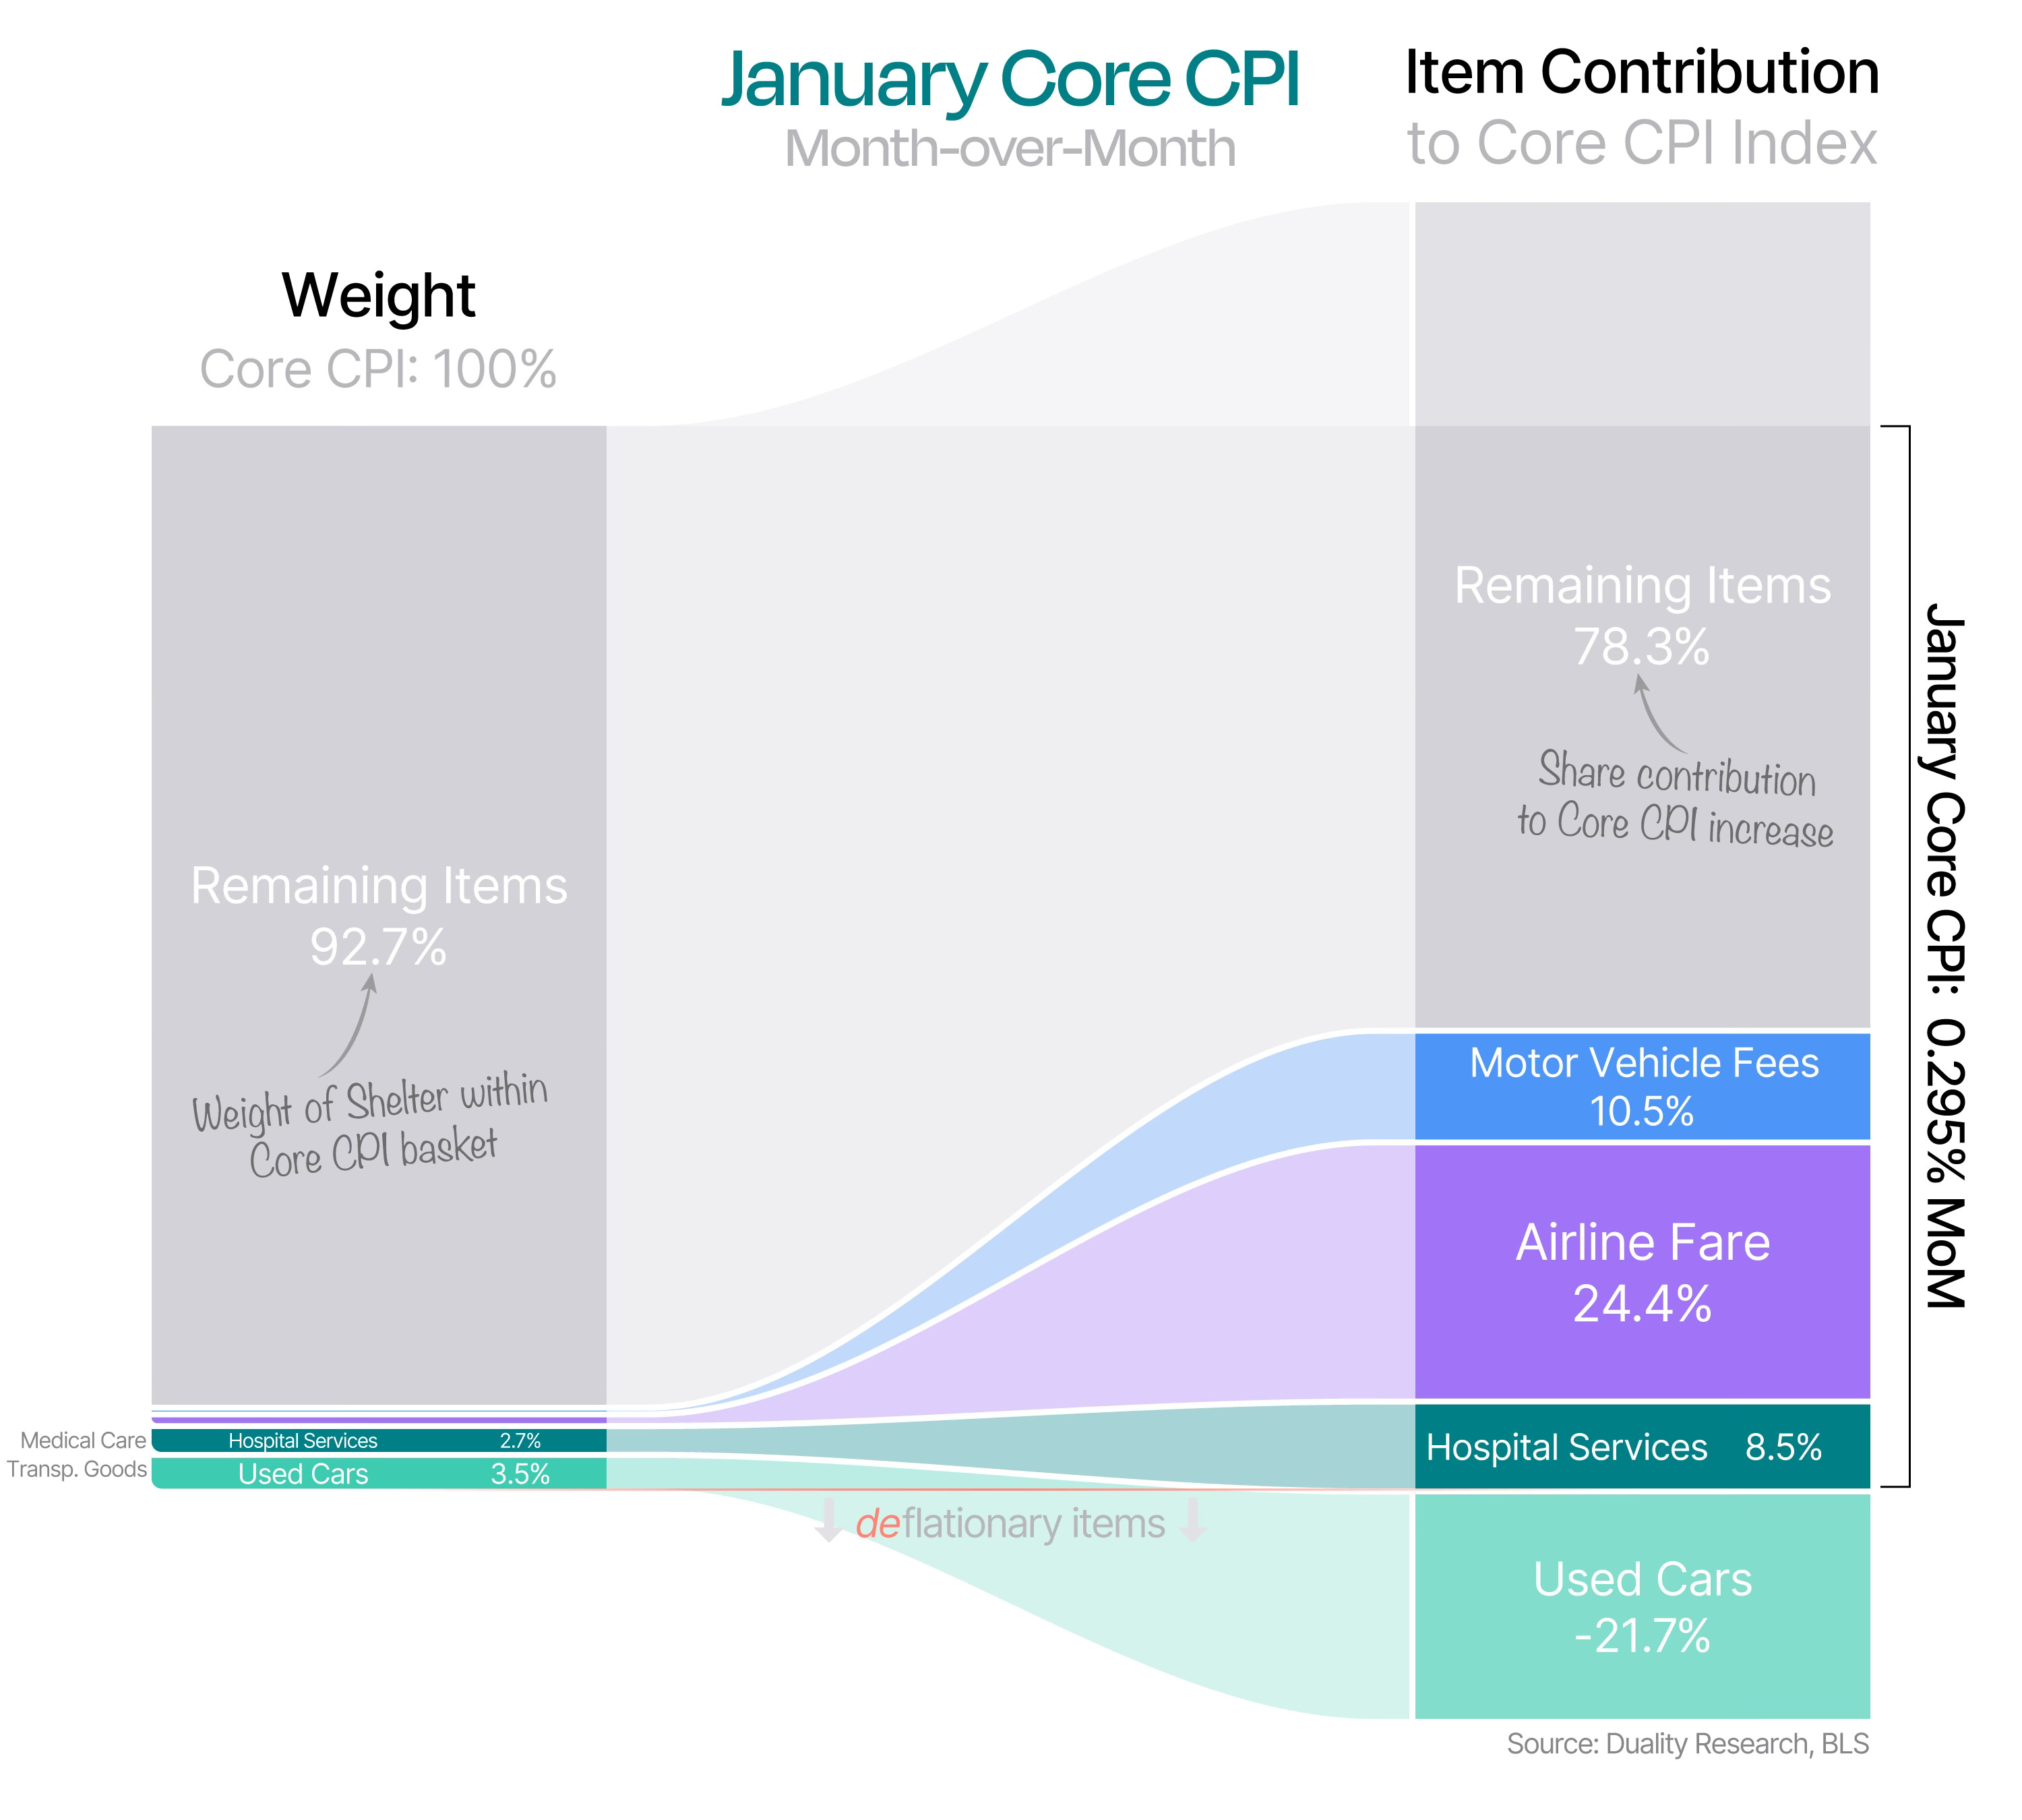
February Core CPI — Month-over-Month
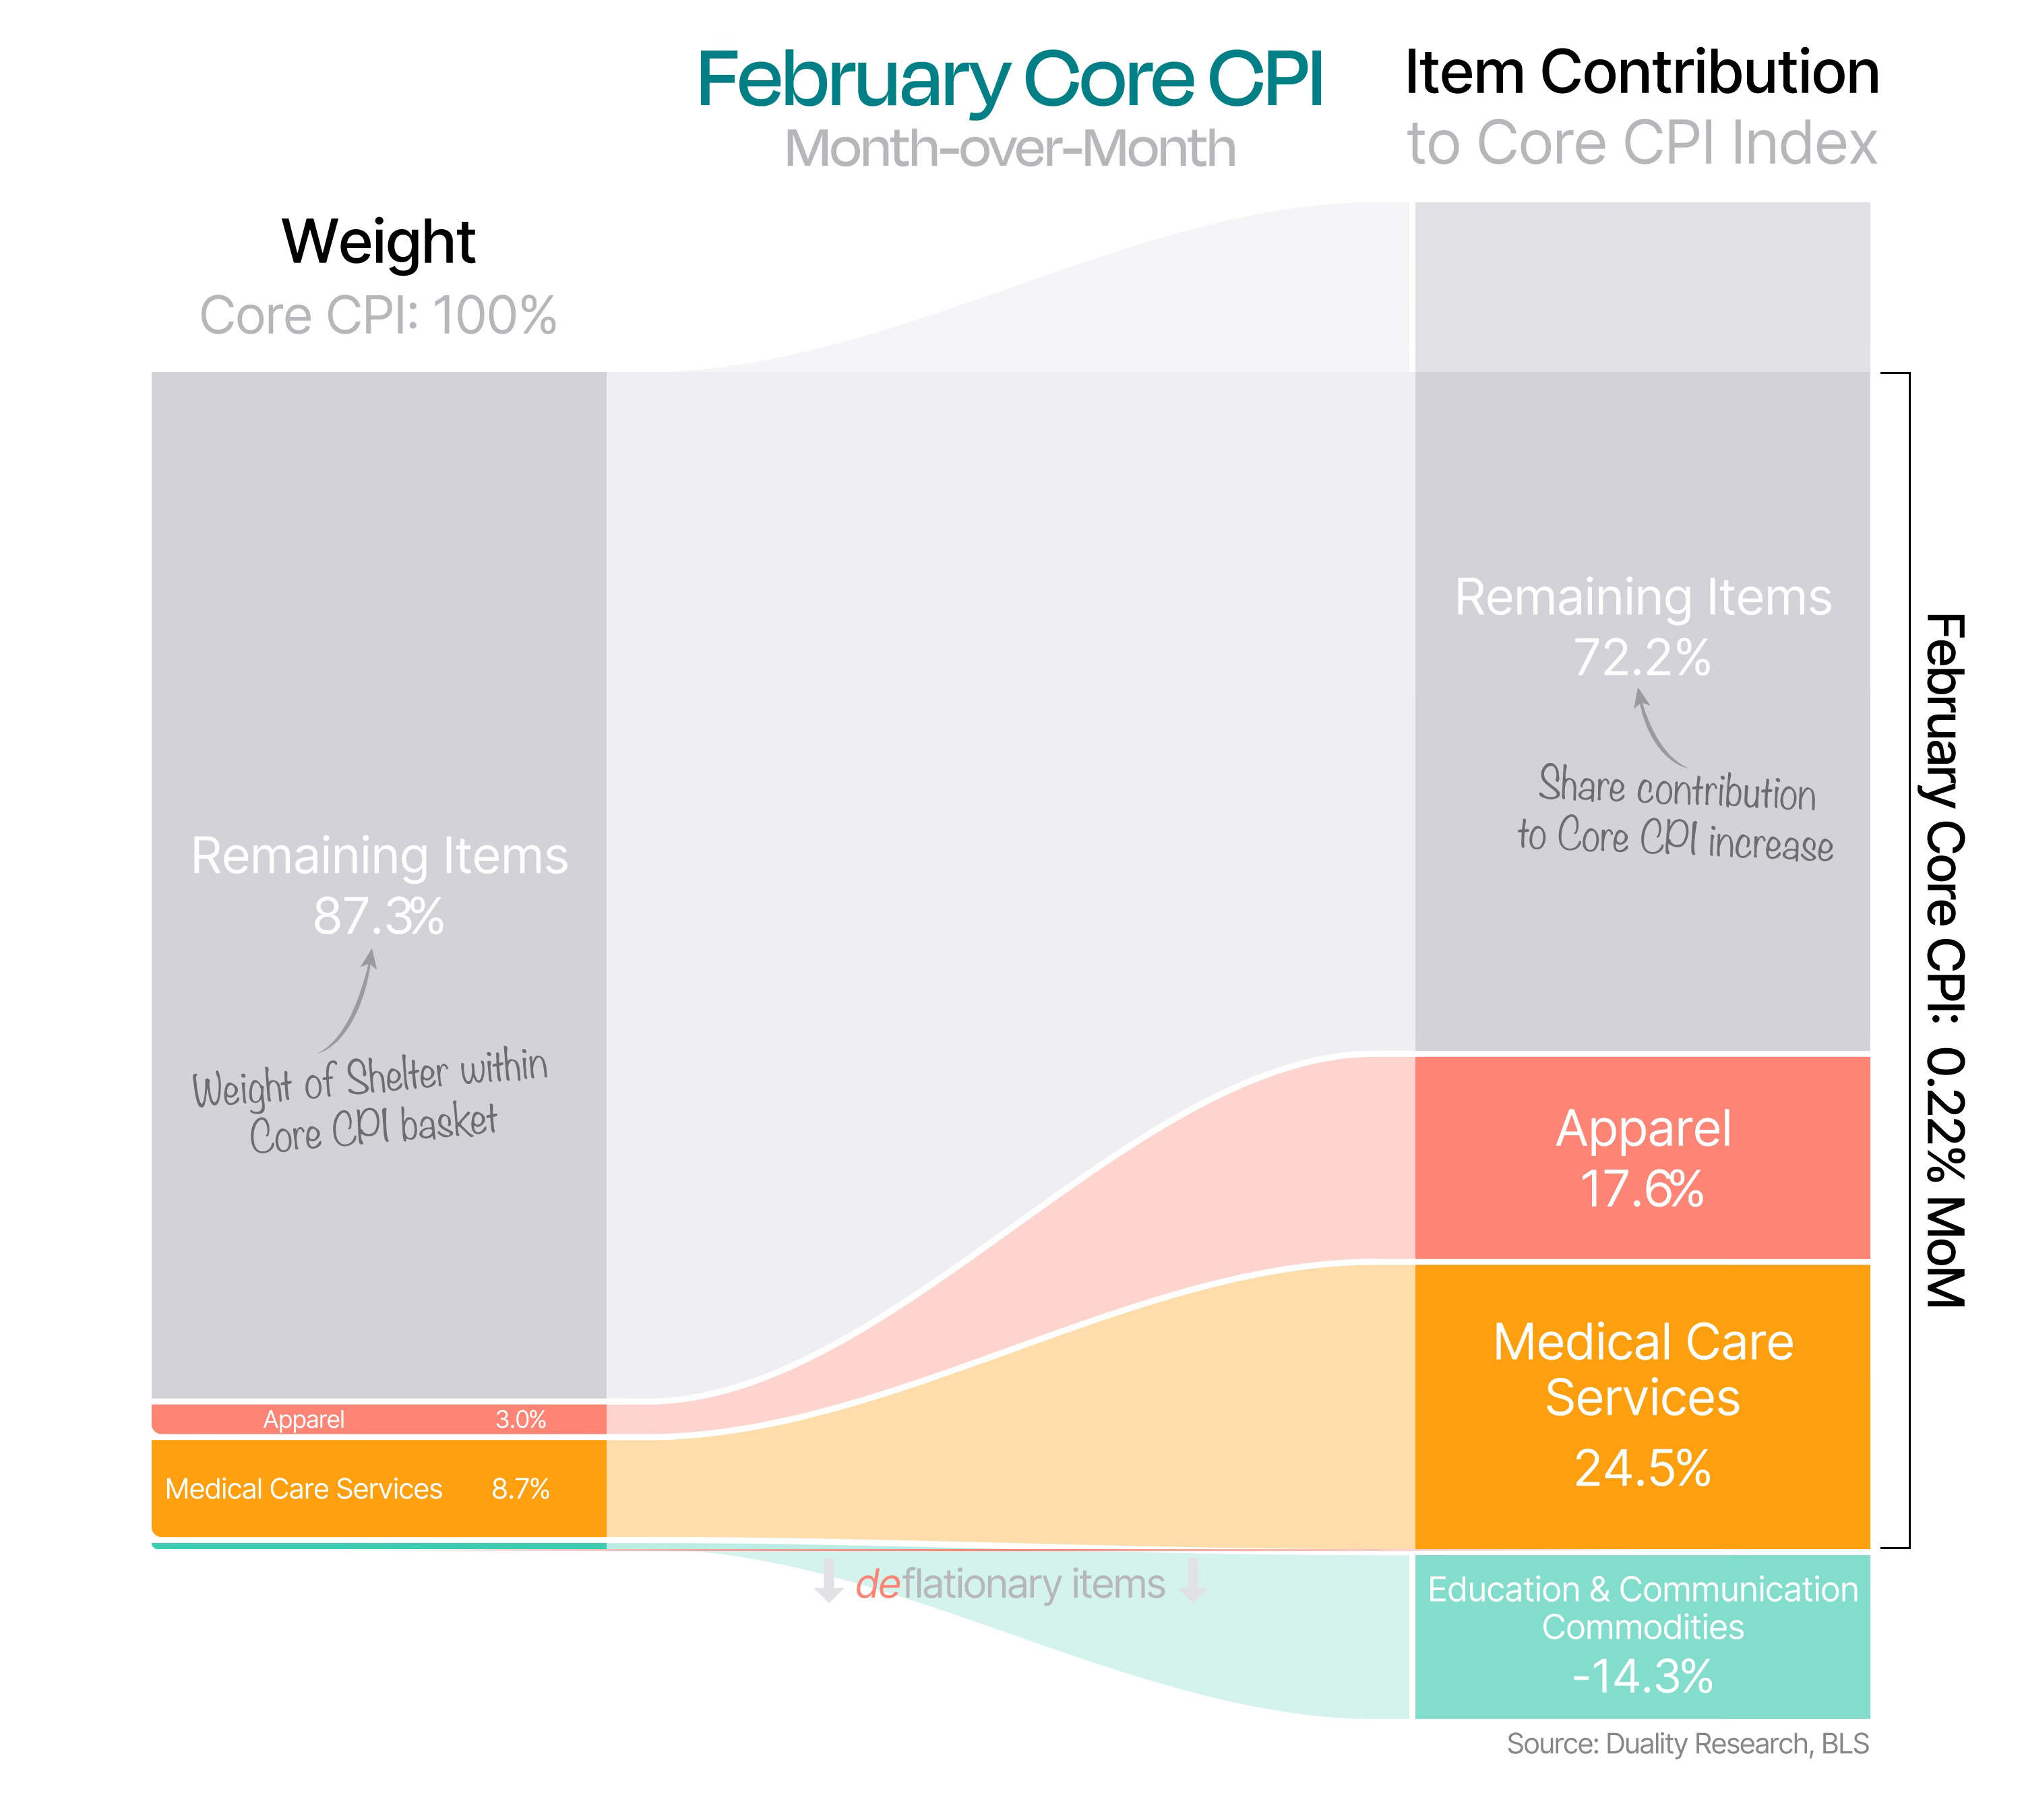
Overall, an in-line February inflation print.
Core CPI was up 0.22% on the month, with some outsized drivers like Medical Care Services, and especially Apparel.
Notably, Education and Communication Goods — particularly telephone hardware, calculators, and other consumer information items — declined sharply!
On a year-over-year basis, Core CPI continues to be driven by the usual major contributors, mainly Shelter and Hospital Services.
Meanwhile, most of the excess YoY inflation still stems from Shelter. And as we’ve discussed many times before, official Shelter data significantly lags behind real-time private market indicators.
Basically, today’s numbers still include rent hikes from 15 months ago. But since real-time housing data is still below the Fed’s 2% target (per WisdomTree), we want to strip that out and here’s what we get:
February CPI less Shelter is up 2.1% YoY vs 2.4% for CPI.
February Core CPI less Shelter is up 2.1% YoY vs 2.5% for Core CPI.
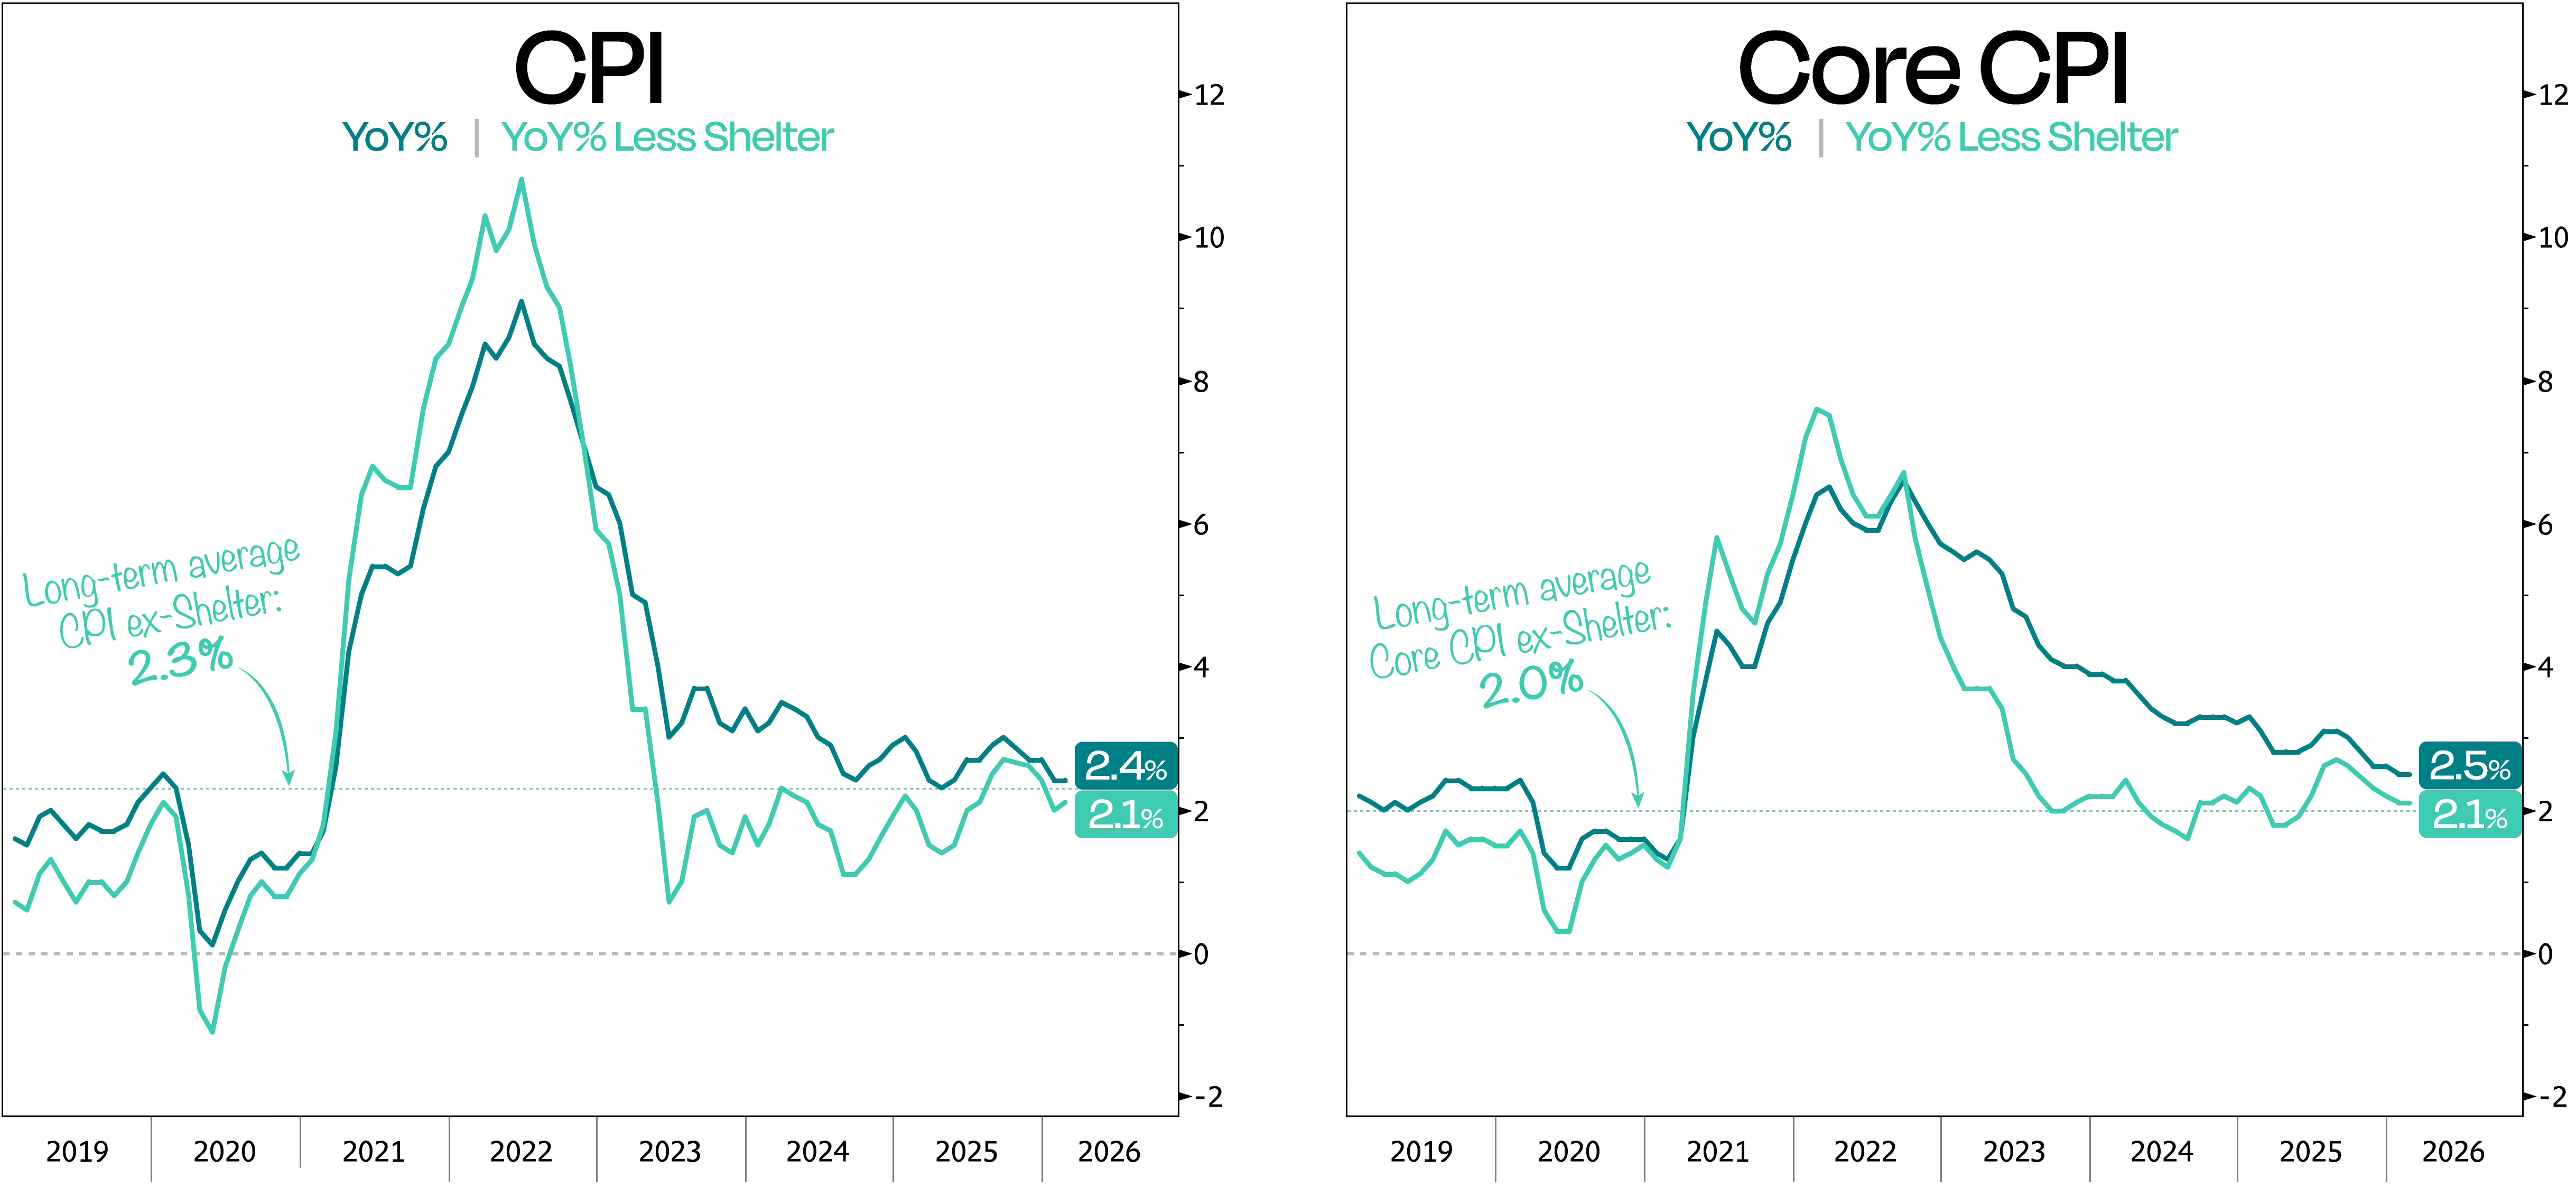
Whenever people ask why we see Shelter inflation further deflating, we like to show them the following chart.
Keep reading with a 7-day free trial
Subscribe to Duality Research to keep reading this post and get 7 days of free access to the full post archives.