The inflation print for May just hit the tape, so let’s dive right in!
Here are the headline prints:
Year-over-Year:
✅ *US MAY CPI RISES 2.4% Y/Y; EST. +2.4%
✅ *US MAY CORE CPI RISES 2.8% Y/Y; EST. +2.9%
Month-over-Month:
✅ *US MAY CPI RISES 0.1% M/M; EST. +0.2%
✅ *US MAY CORE CPI RISES 0.1% M/M; EST. +0.3%
For a complete breakdown of last month’s CPI,
download our US Inflation Dashboard.
May CPI — Year-over-Year
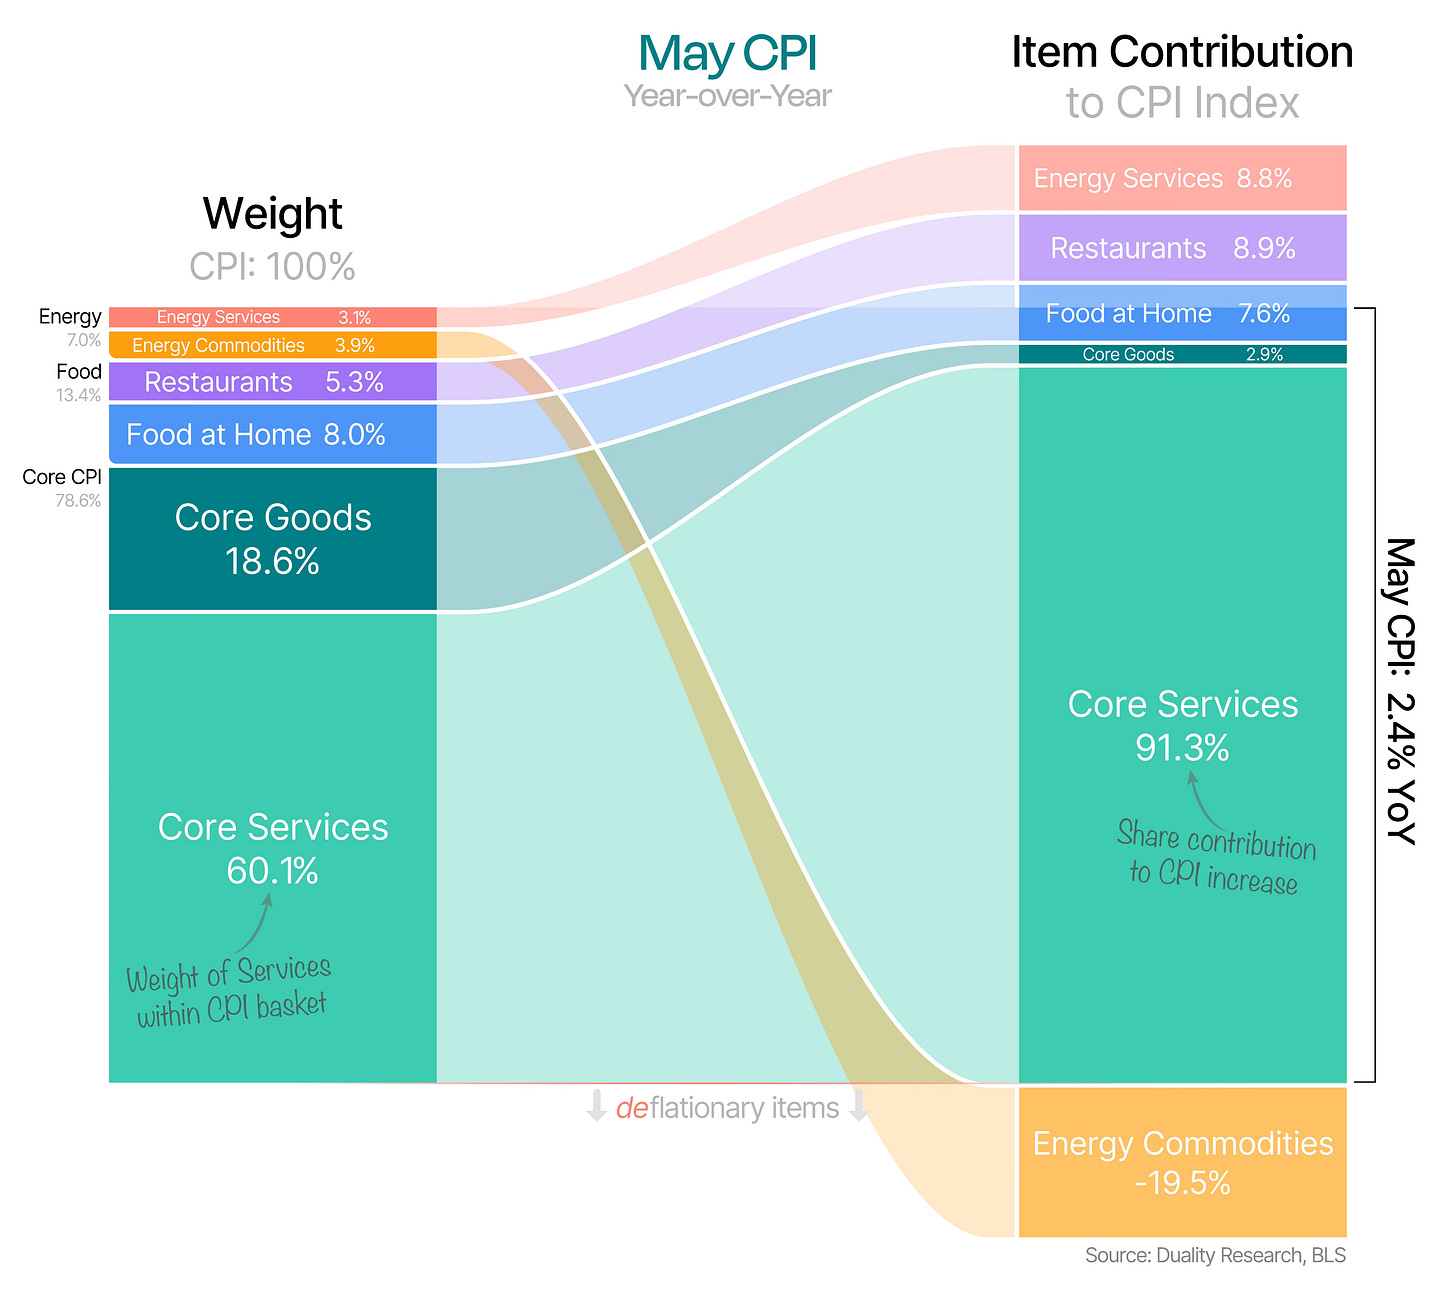
Let’s start with our chart that shows the weight of the three main CPI categories and their respective sub-groups on the left. On the right, you can see how each item contributes to the overall index.
(see April CPI)
Next up, we’ve got two charts breaking down Core CPI — one showing year-over-year (YoY) changes and the other highlighting month-over-month (MoM) shifts, focusing on items with the most disproportionate impact.
Keep reading with a 7-day free trial
Subscribe to Duality Research to keep reading this post and get 7 days of free access to the full post archives.


