


Holding the Hedge, Not Losing the Plot
Thoughts on the Market

Our risk management framework – which has kept us long since April 22 – came through again in spotting early warning signs.
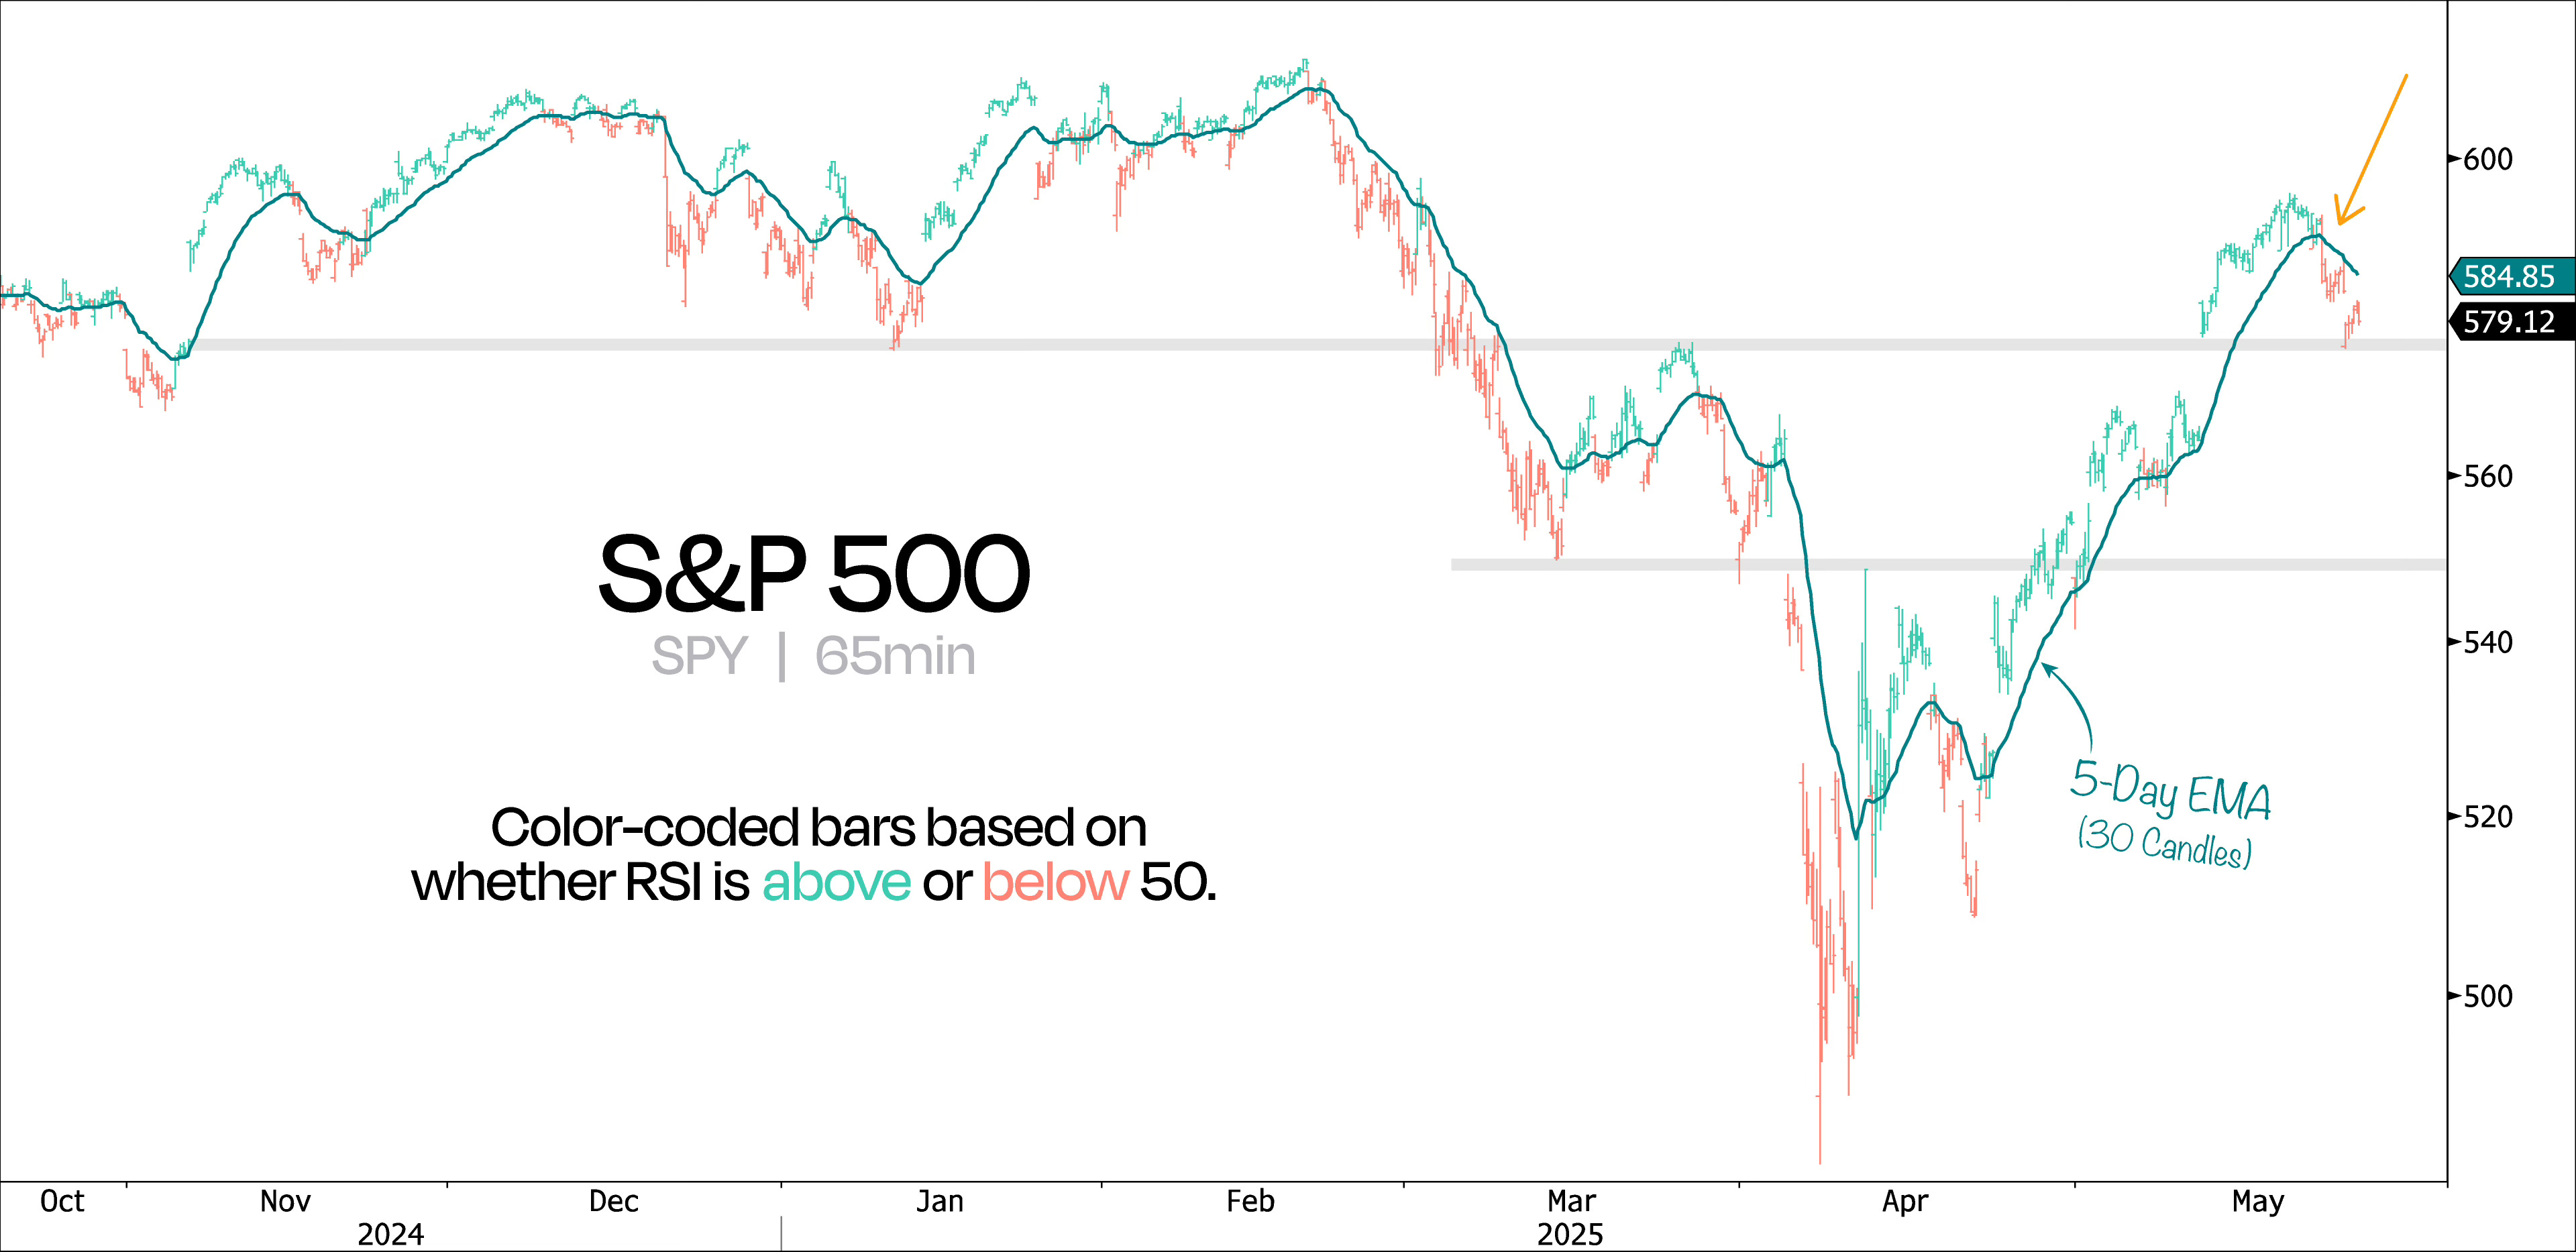
Last Wednesday, the S&P 500 (on a 65-minute chart) dipped below its 5-day exponential moving average for the first time in a month.
That line also happens to mark whether the RSI is above or below 50, so when it breaks, we pay attention.
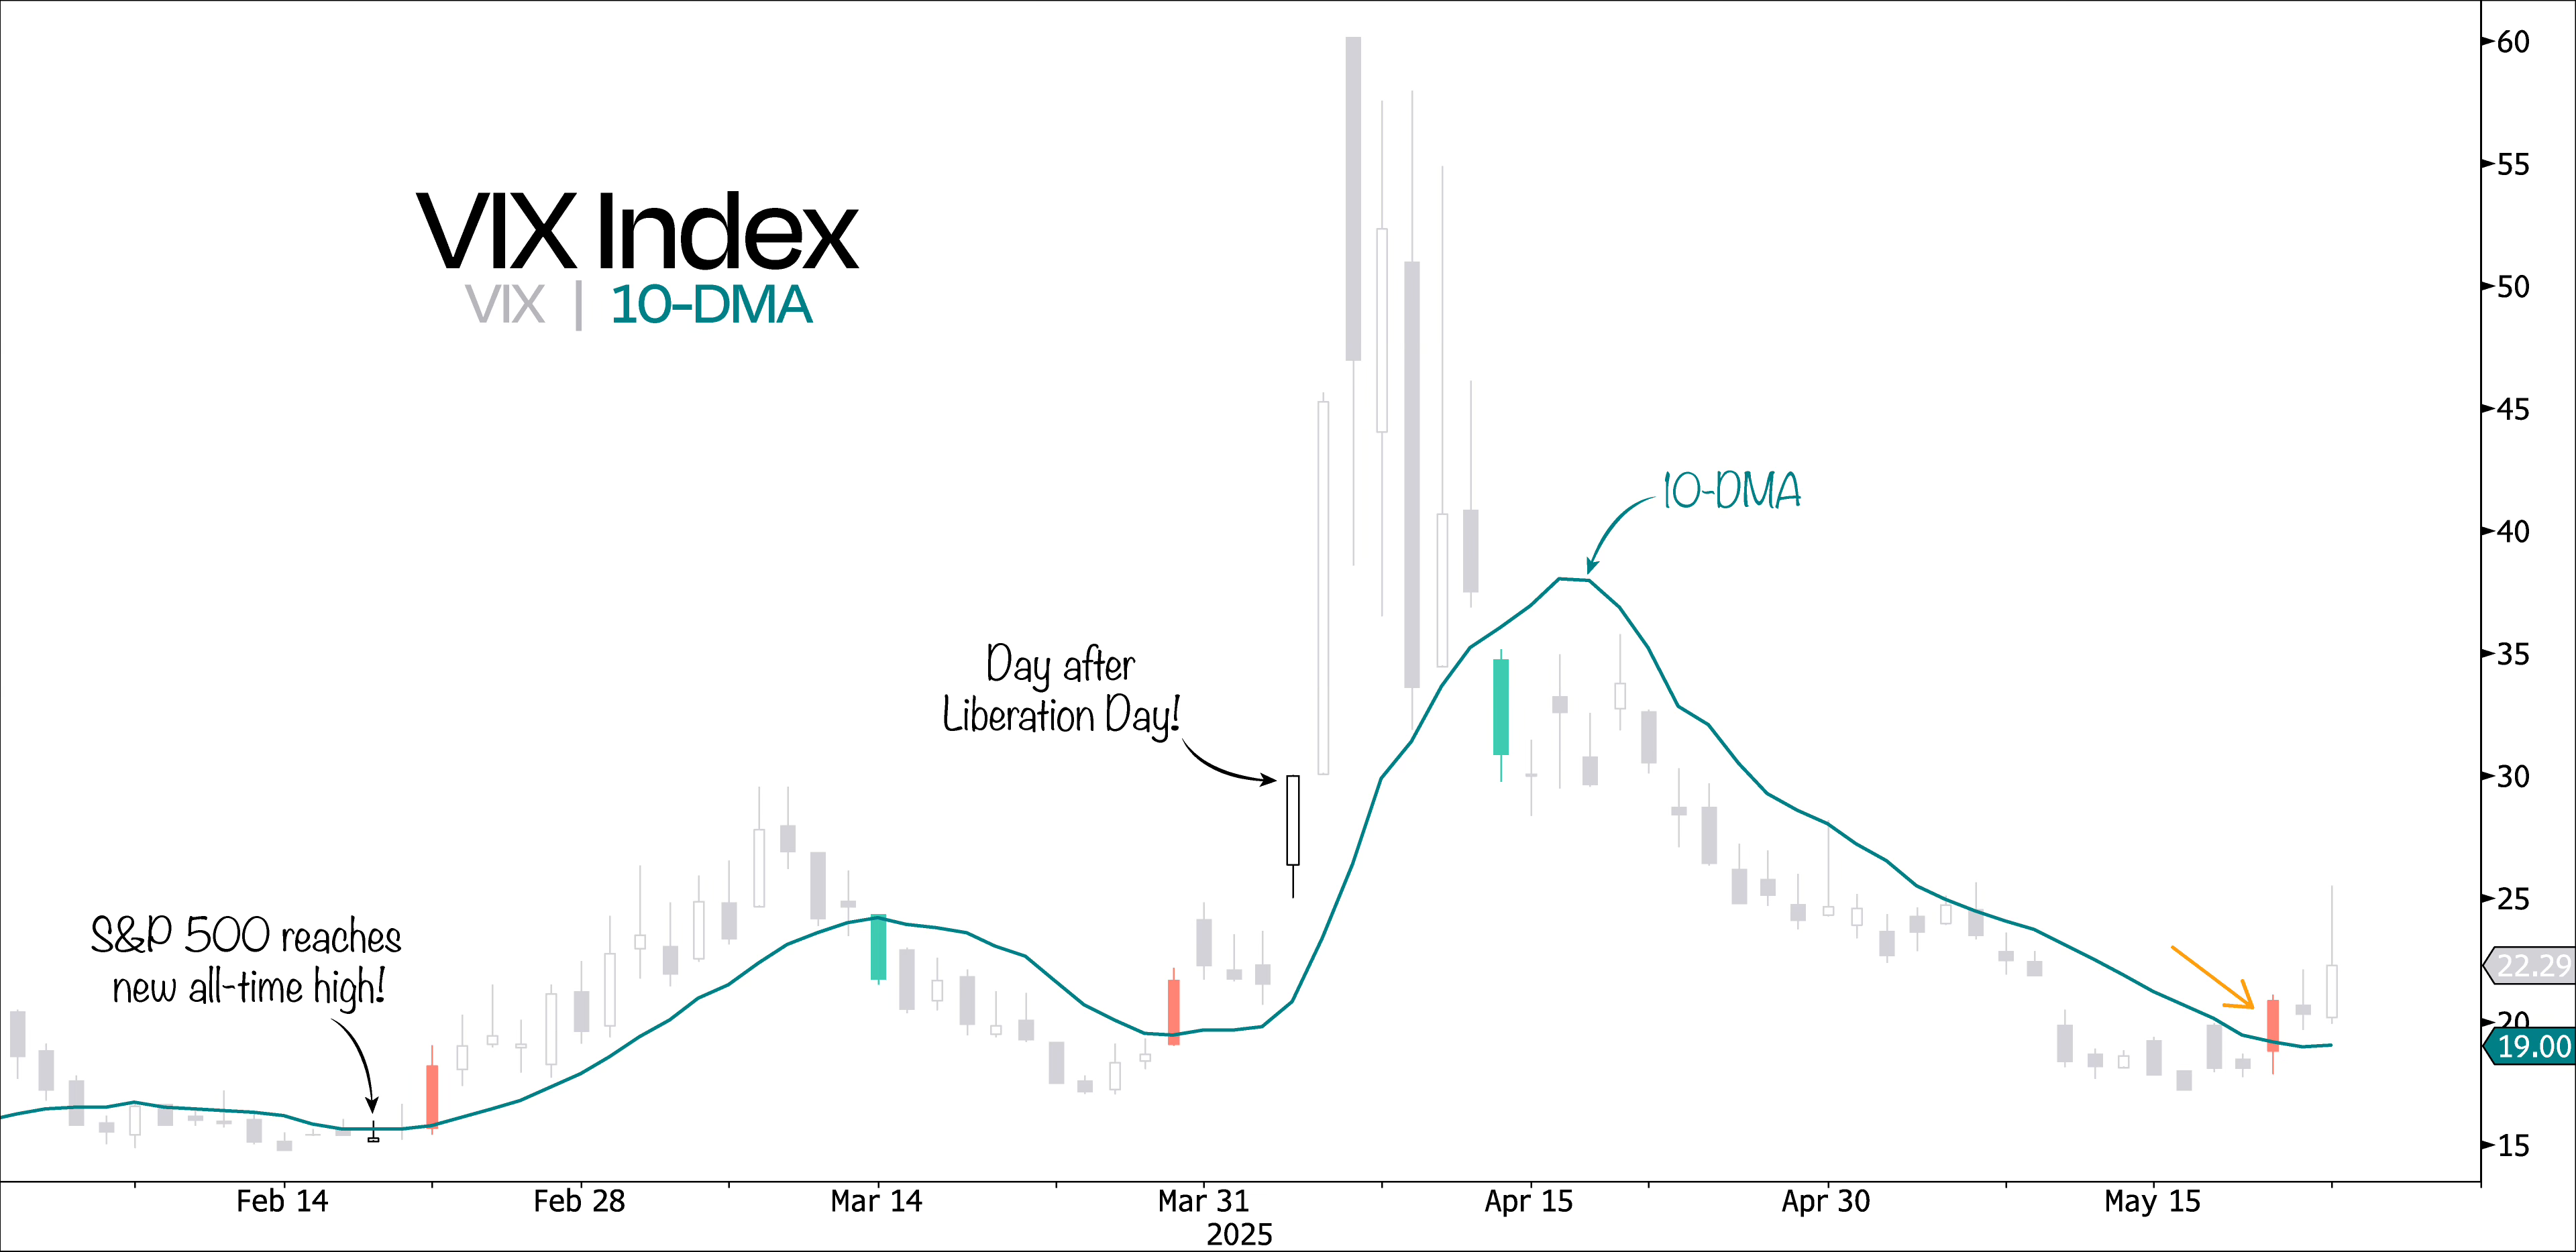
On top of that, the VIX closed above its 10-day moving average for the first time since April 11.
As we’ve emphasized repeatedly, this combination of signals is a key trigger in our framework – prompting us to implement hedges and adopt a more cautious stance.
What’s interesting is that last Wednesday’s dip, which turned us short-term bearish, had a couple of key things worth noting:
It was the first 1%+ drop for the S&P 500 since April 21
The market had its 3rd-worst reaction ever to a bond auction
A massive 87% of total NYSE volume was on the downside – the highest since the April 8 low
And 485 out of 500 S&P names closed red – the most we’ve seen since April 4
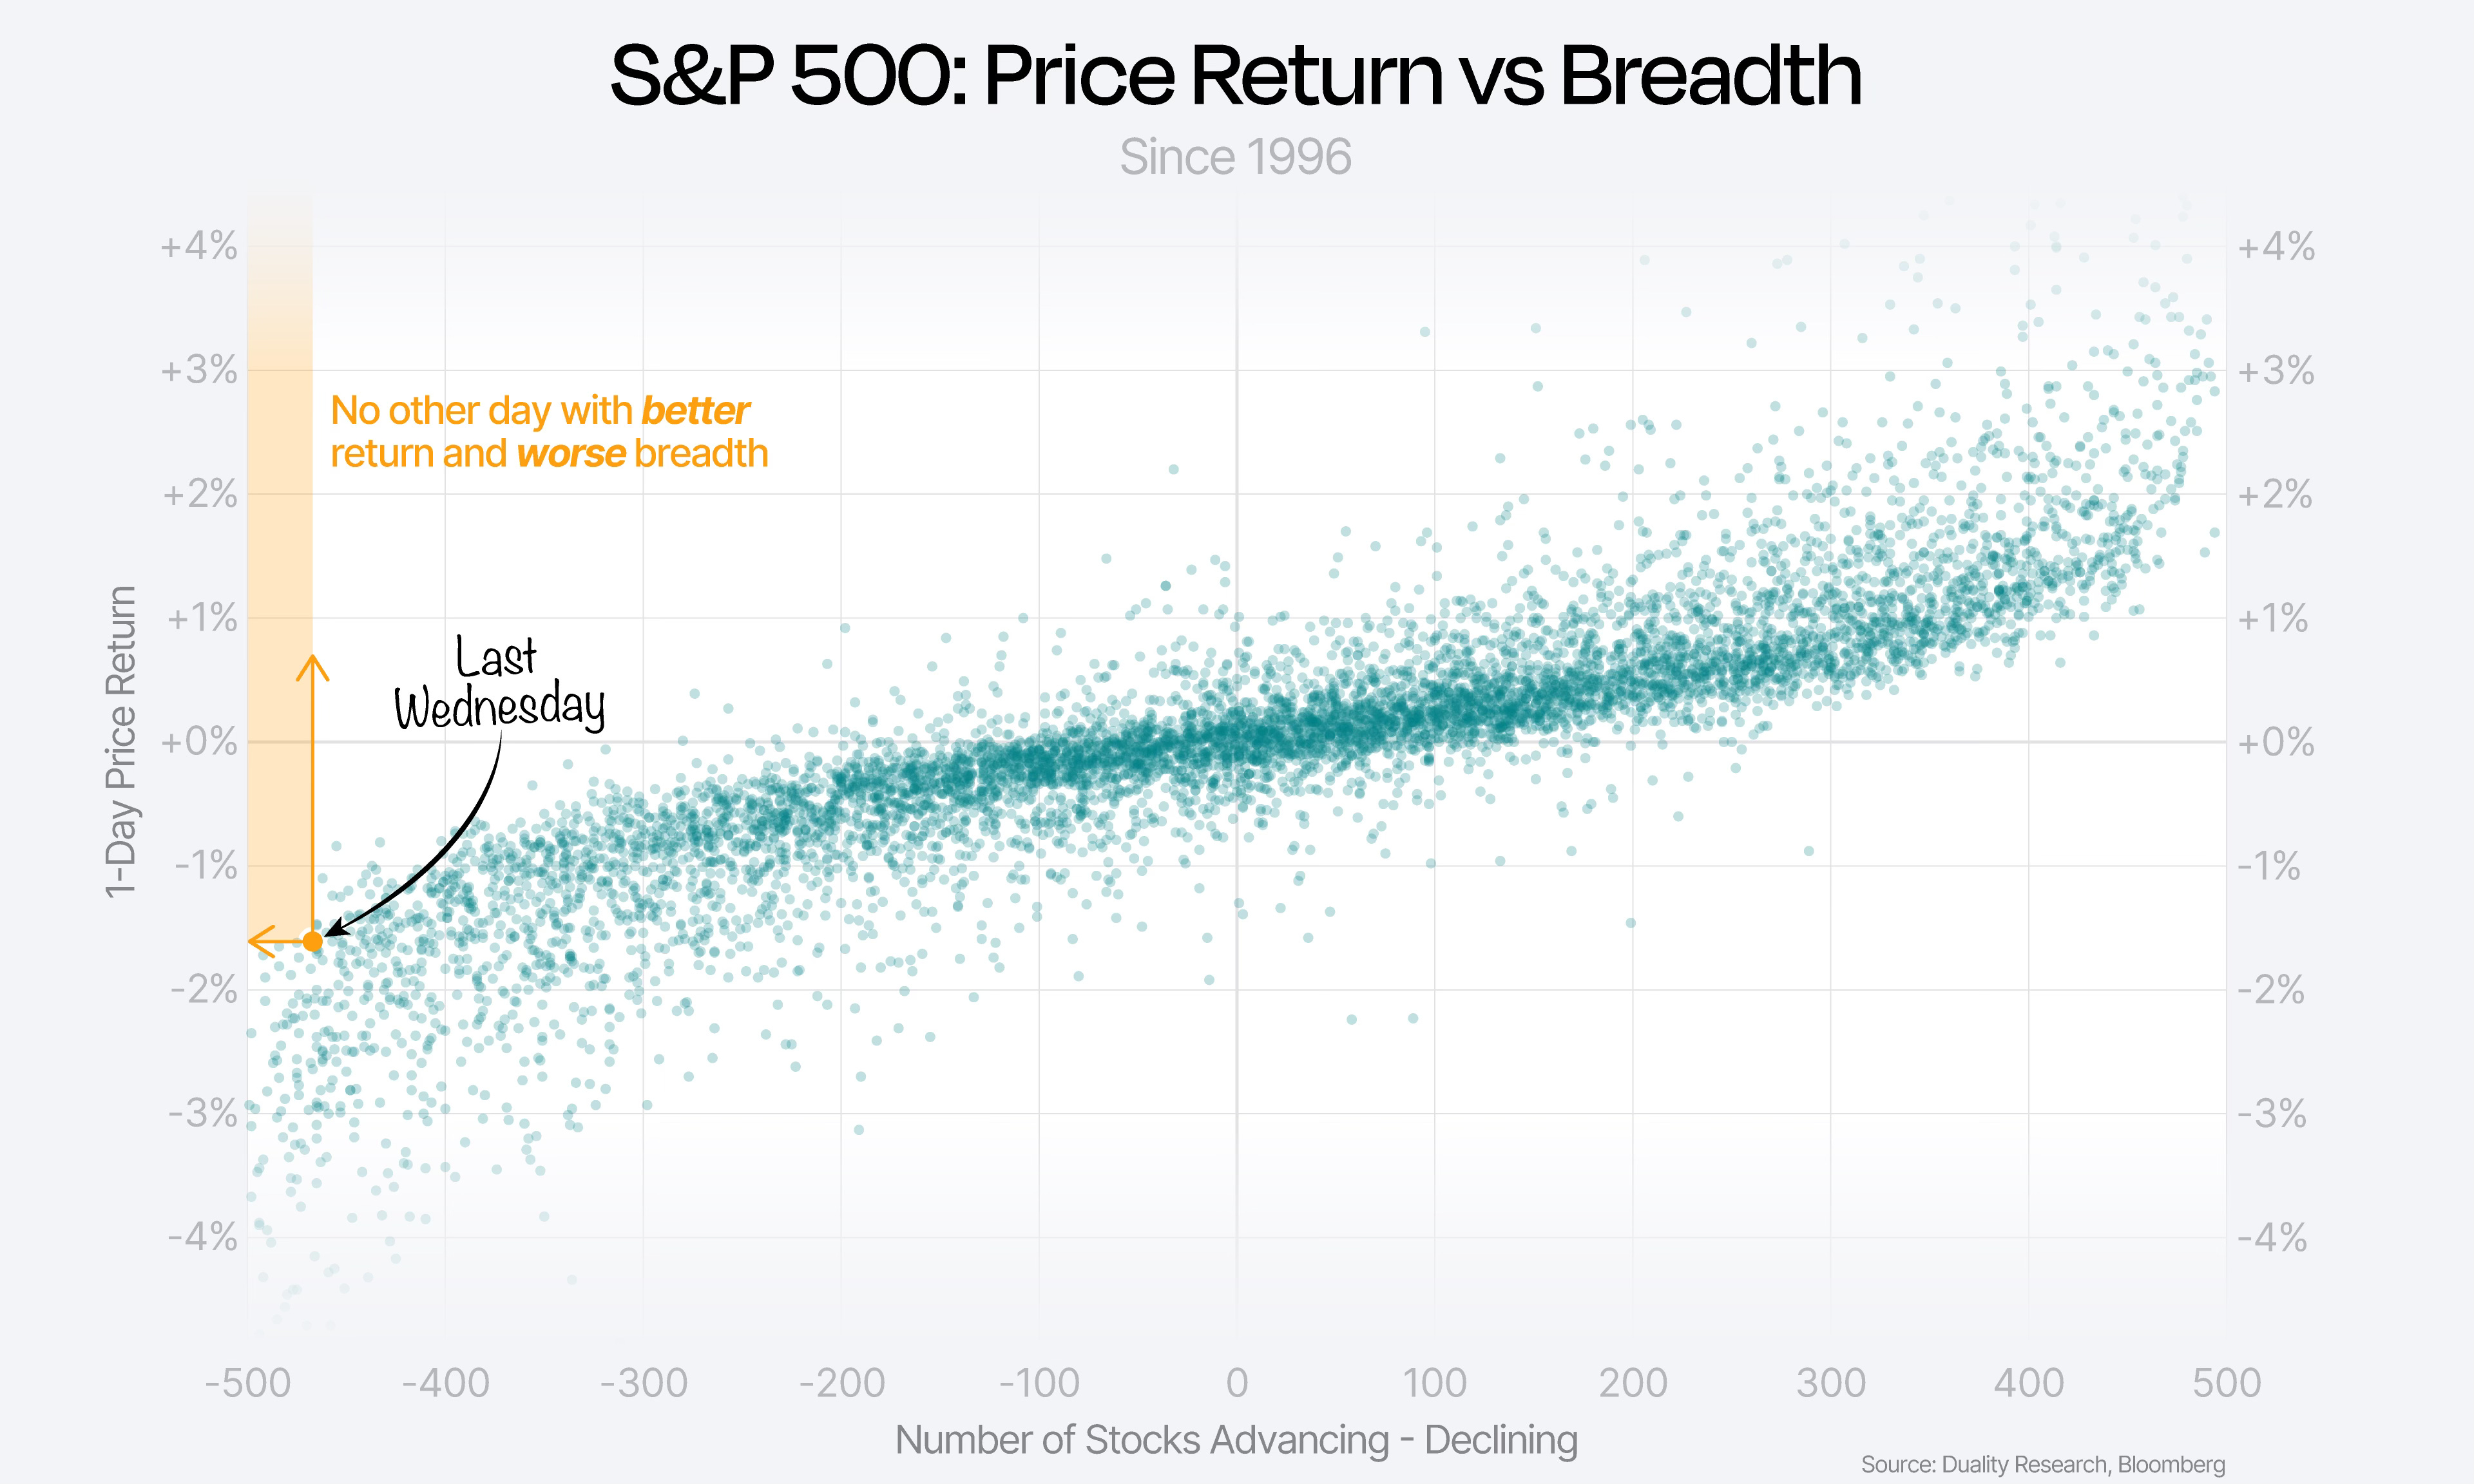
In fact, Wednesday’s selloff had a unique combination of return and participation that stands out historically.
Going all the way back to 1996, there hasn’t been another day with worse breadth paired with a better return.
You can see this in our chart below, where we plot daily S&P 500 returns against market breadth.
Now, given that we’ve just re-entered a Breadth Thrust Regime, it’s good to remember that pullbacks during these periods tend to be shallow and short-lived.
While we’ve turned cautious in the short term, getting too bearish here could backfire – especially considering that all of the S&P 500’s net gains since 1997 have come during these post-thrust periods.
The chart below shows it clearly: Breadth Thrusts typically kick off steady, quiet strength.

With that in mind, we probably don’t need to dig too deep on the chart to spot where support might show up first.
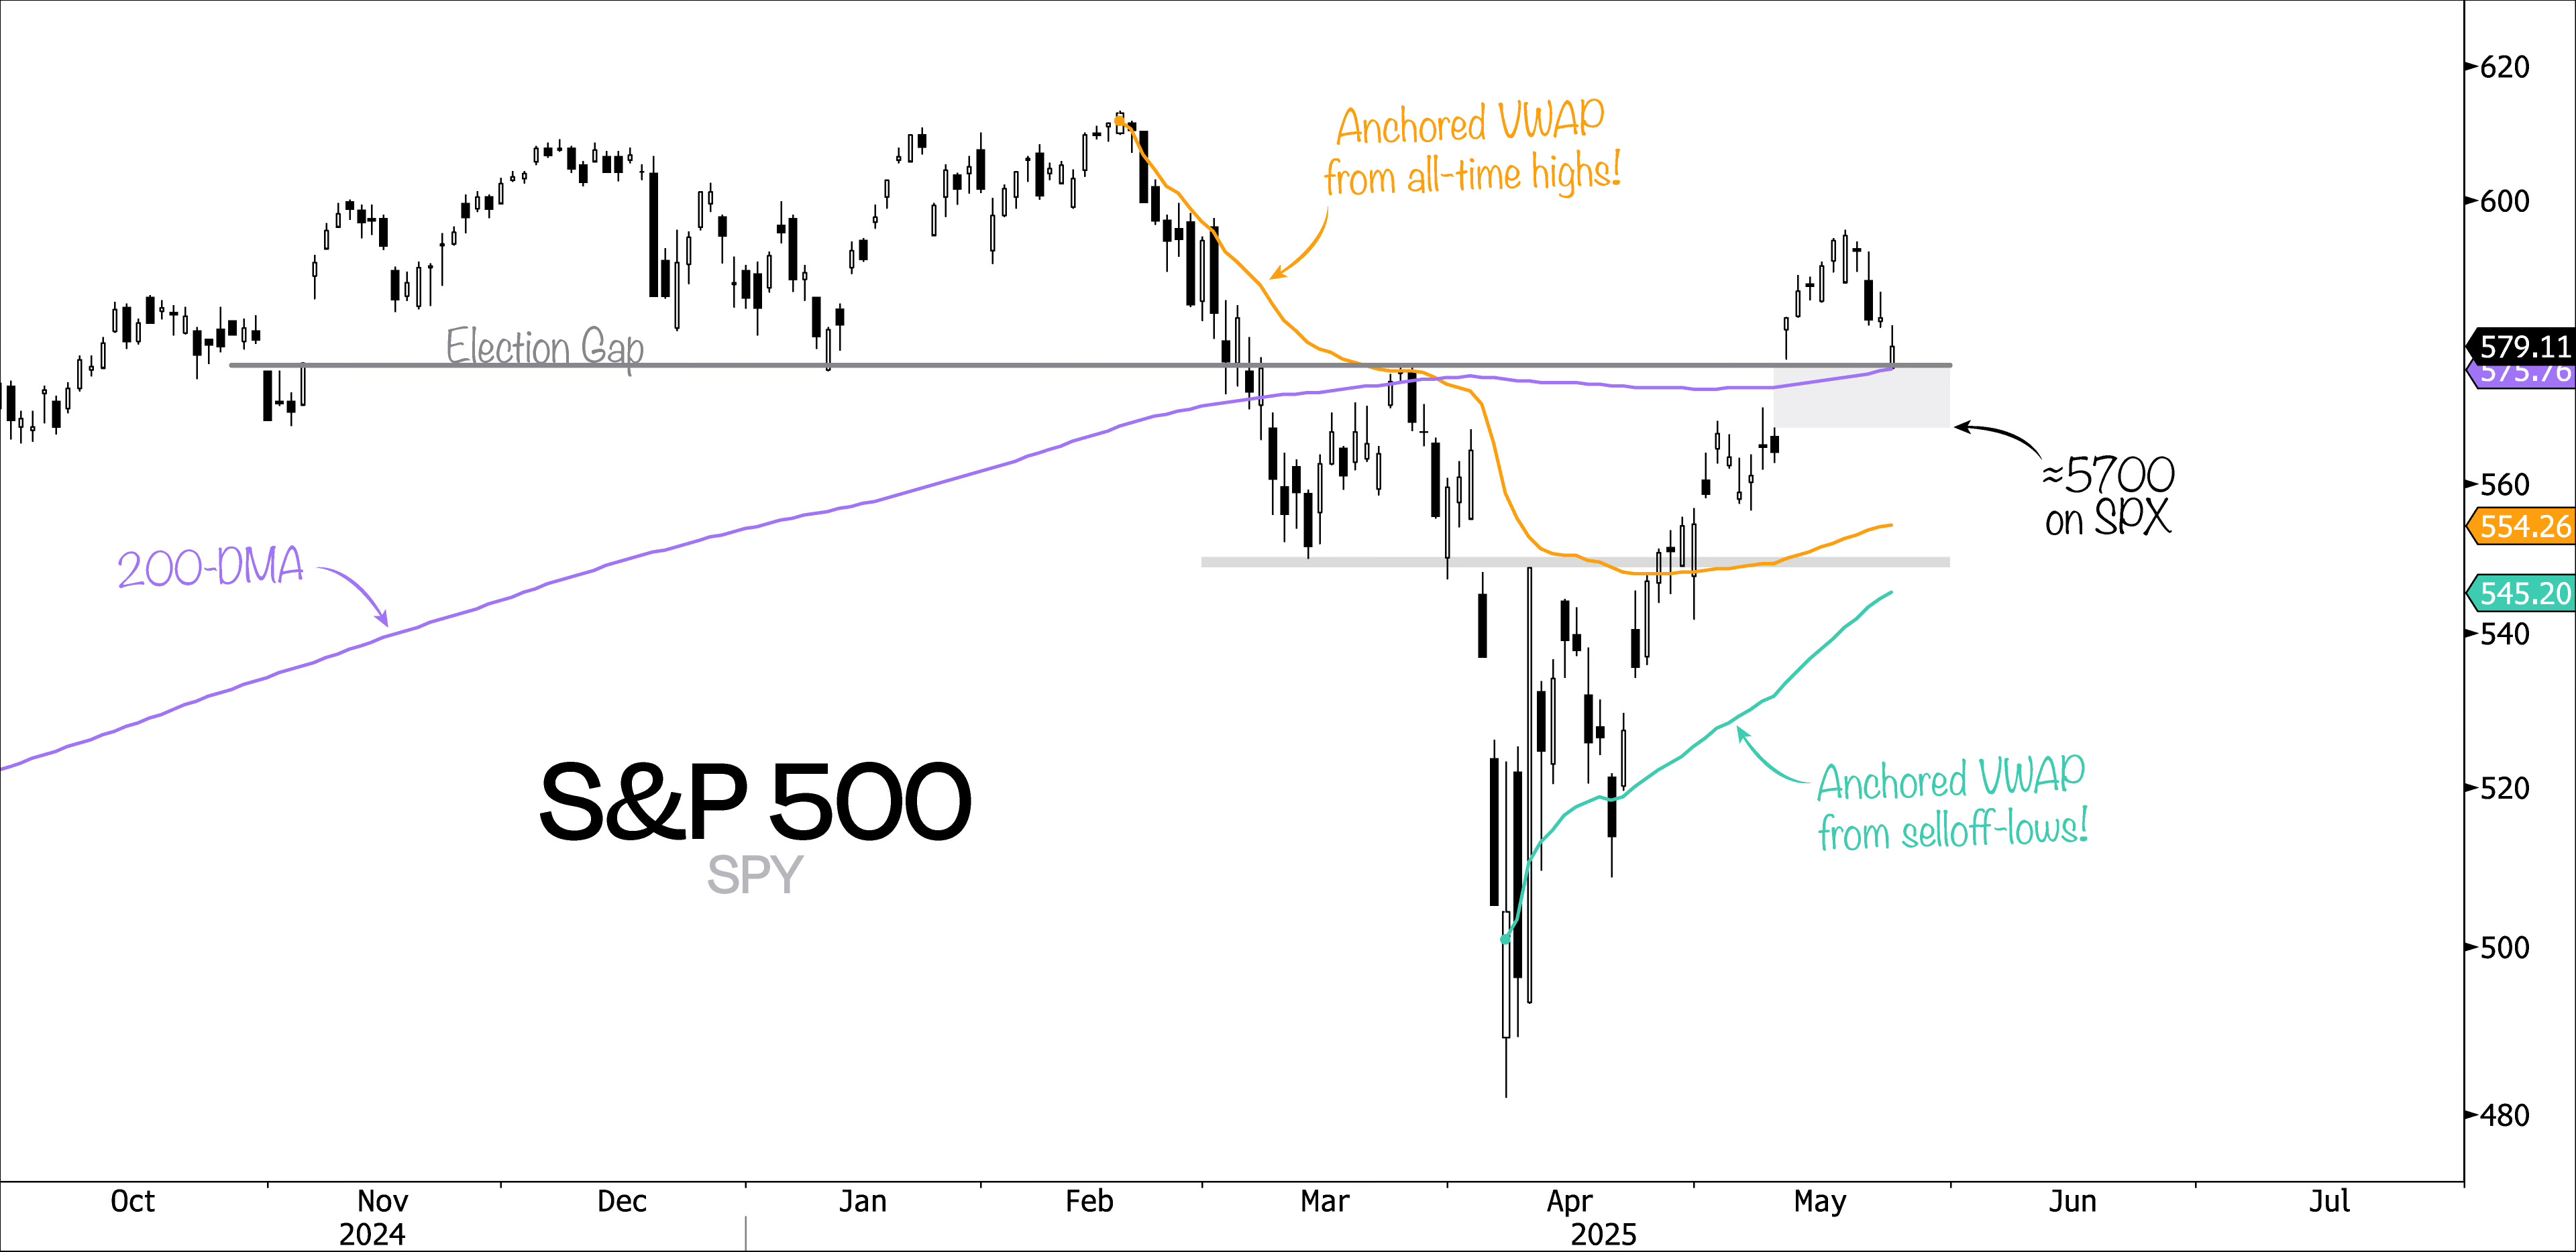
The gap below the 200-day moving average seems like a natural spot where buyers could step in.
In fact, we already saw some evidence of this last Friday when Trump’s tariff encore rattled the market, with prices bouncing right at the 200-DMA – which also happens to line up with the election gap.
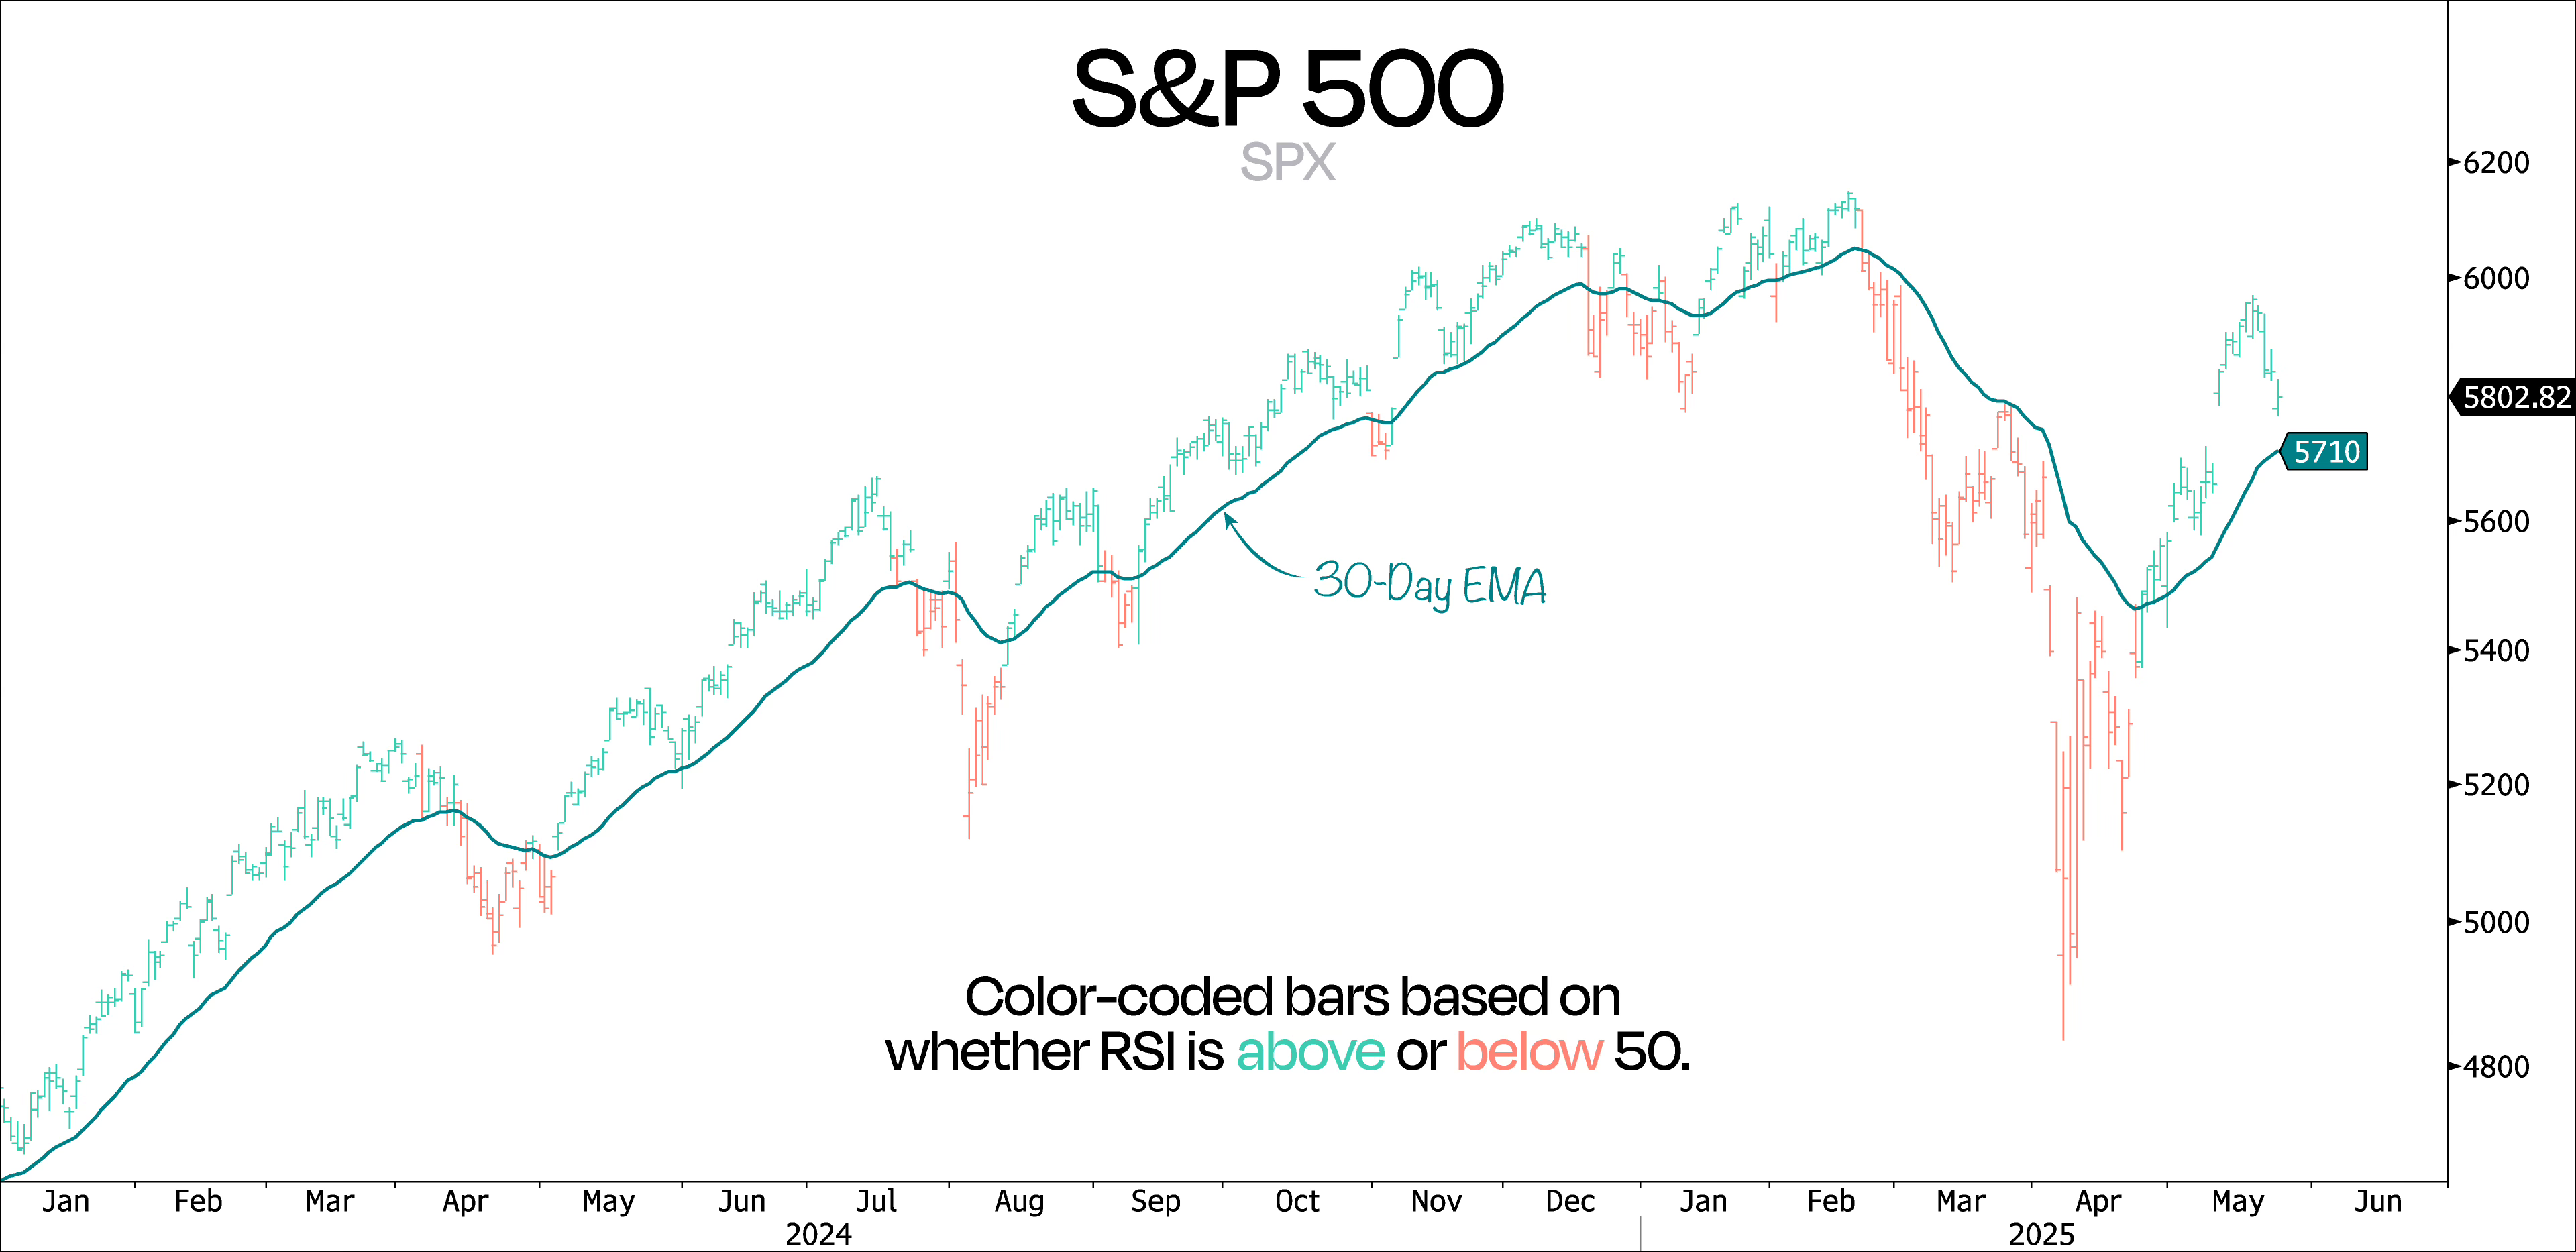
But to actually close that gap, we’d need a quick dip down to around 5700 – about 1.3% below the 200-DMA.
Now, if we do get a round-two of tariff drama, a 7–8% pullback from the rally highs wouldn’t be shocking.
That would drag us back to the 5500 zone – basically, the scene of the crime.
Not only is this a clearly defined zone of interest, but with both anchored VWAPs from the all-time highs and the selloff-lows clustering there, we’d characterize this area as a strong technical support zone.
Interestingly, if the S&P doesn’t hold 5700, the RSI would drop into bearish momentum for the first time since April 23.
In the chart below, we’ve color-coded the bars based on whether the RSI is above or below 50.
What’s cool is that the 50 RSI level lines up almost exactly with whether the price is above or below its 30-day EMA.
So, in other words, momentum would flip from bullish to bearish right around 5710.
That said, we still think the market will fill the gap and bounce back, mainly because a lot of market players are still positioned very bearish.
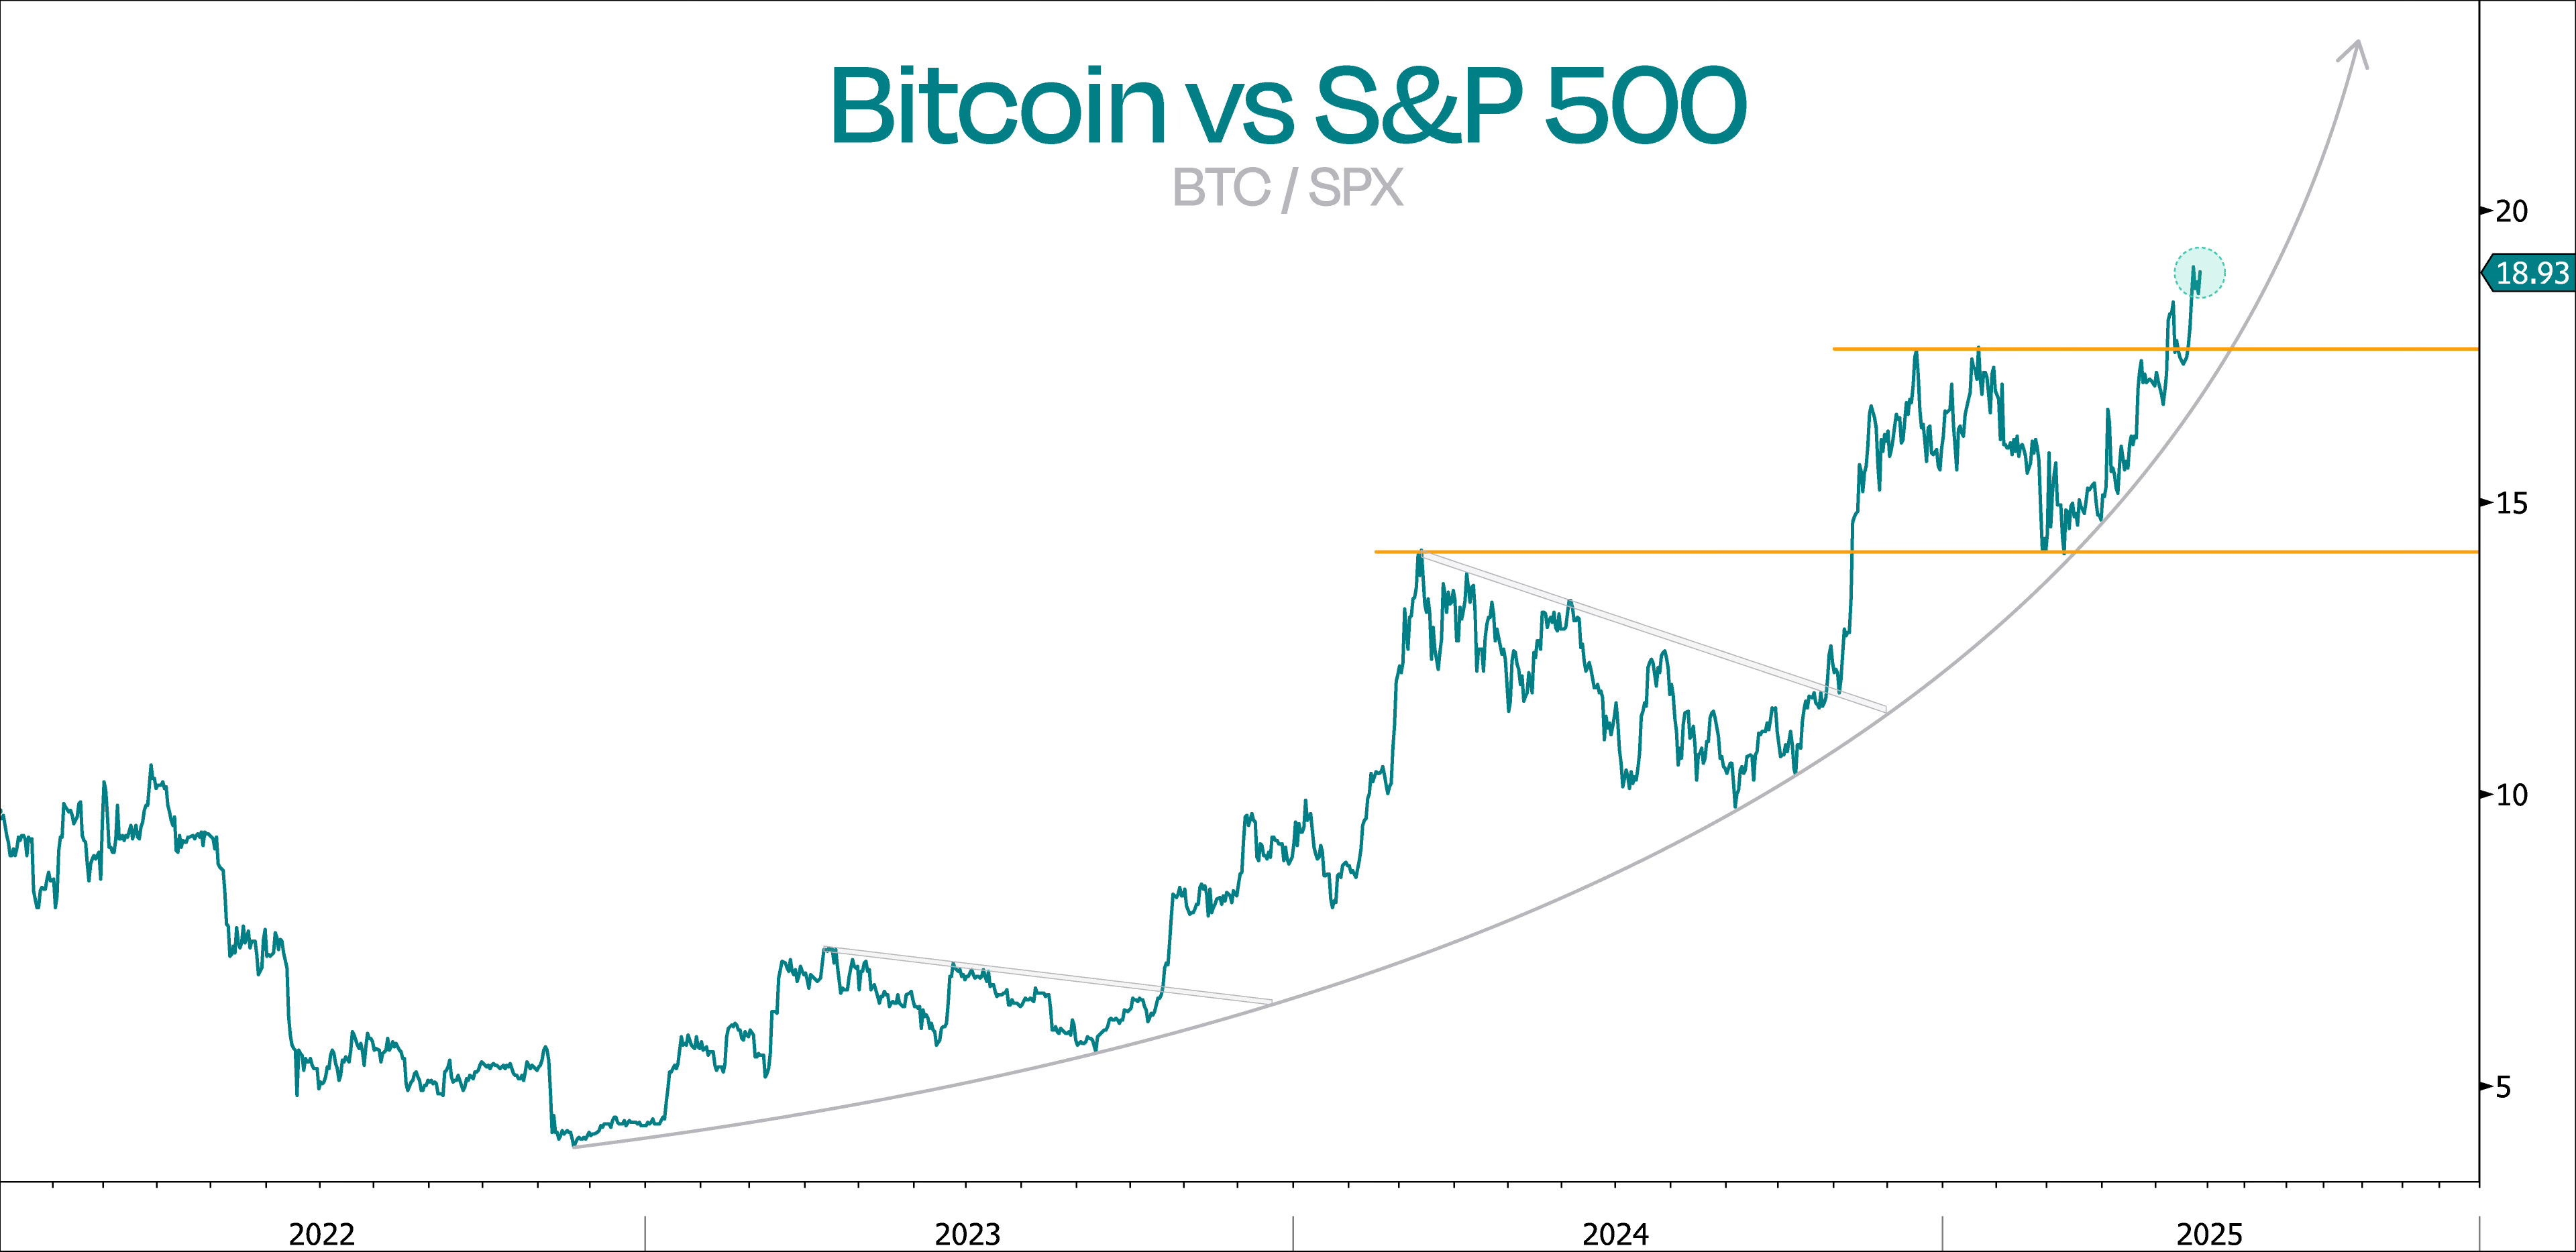
Another reason we don’t expect a big pullback right now is that risky assets like Bitcoin are still outperforming the market.
After a breakout, retest, and rebound, buyers are clearly still in control.
Now, maybe we should take a step back and talk about why equities started coming under pressure in the first place.
Without a doubt, the bond market is on fire again. But let’s clear up two things right off the bat.
First, despite what a lot of people think, the yield curve isn’t just steepening in the US – it’s happening everywhere.
That suggests there’s a global element to this.
Second, this is not about inflation.
Even though the 30-year Treasury yield jumped back above 5%, inflation expectations haven’t really moved – they’re still stuck in a tight range.
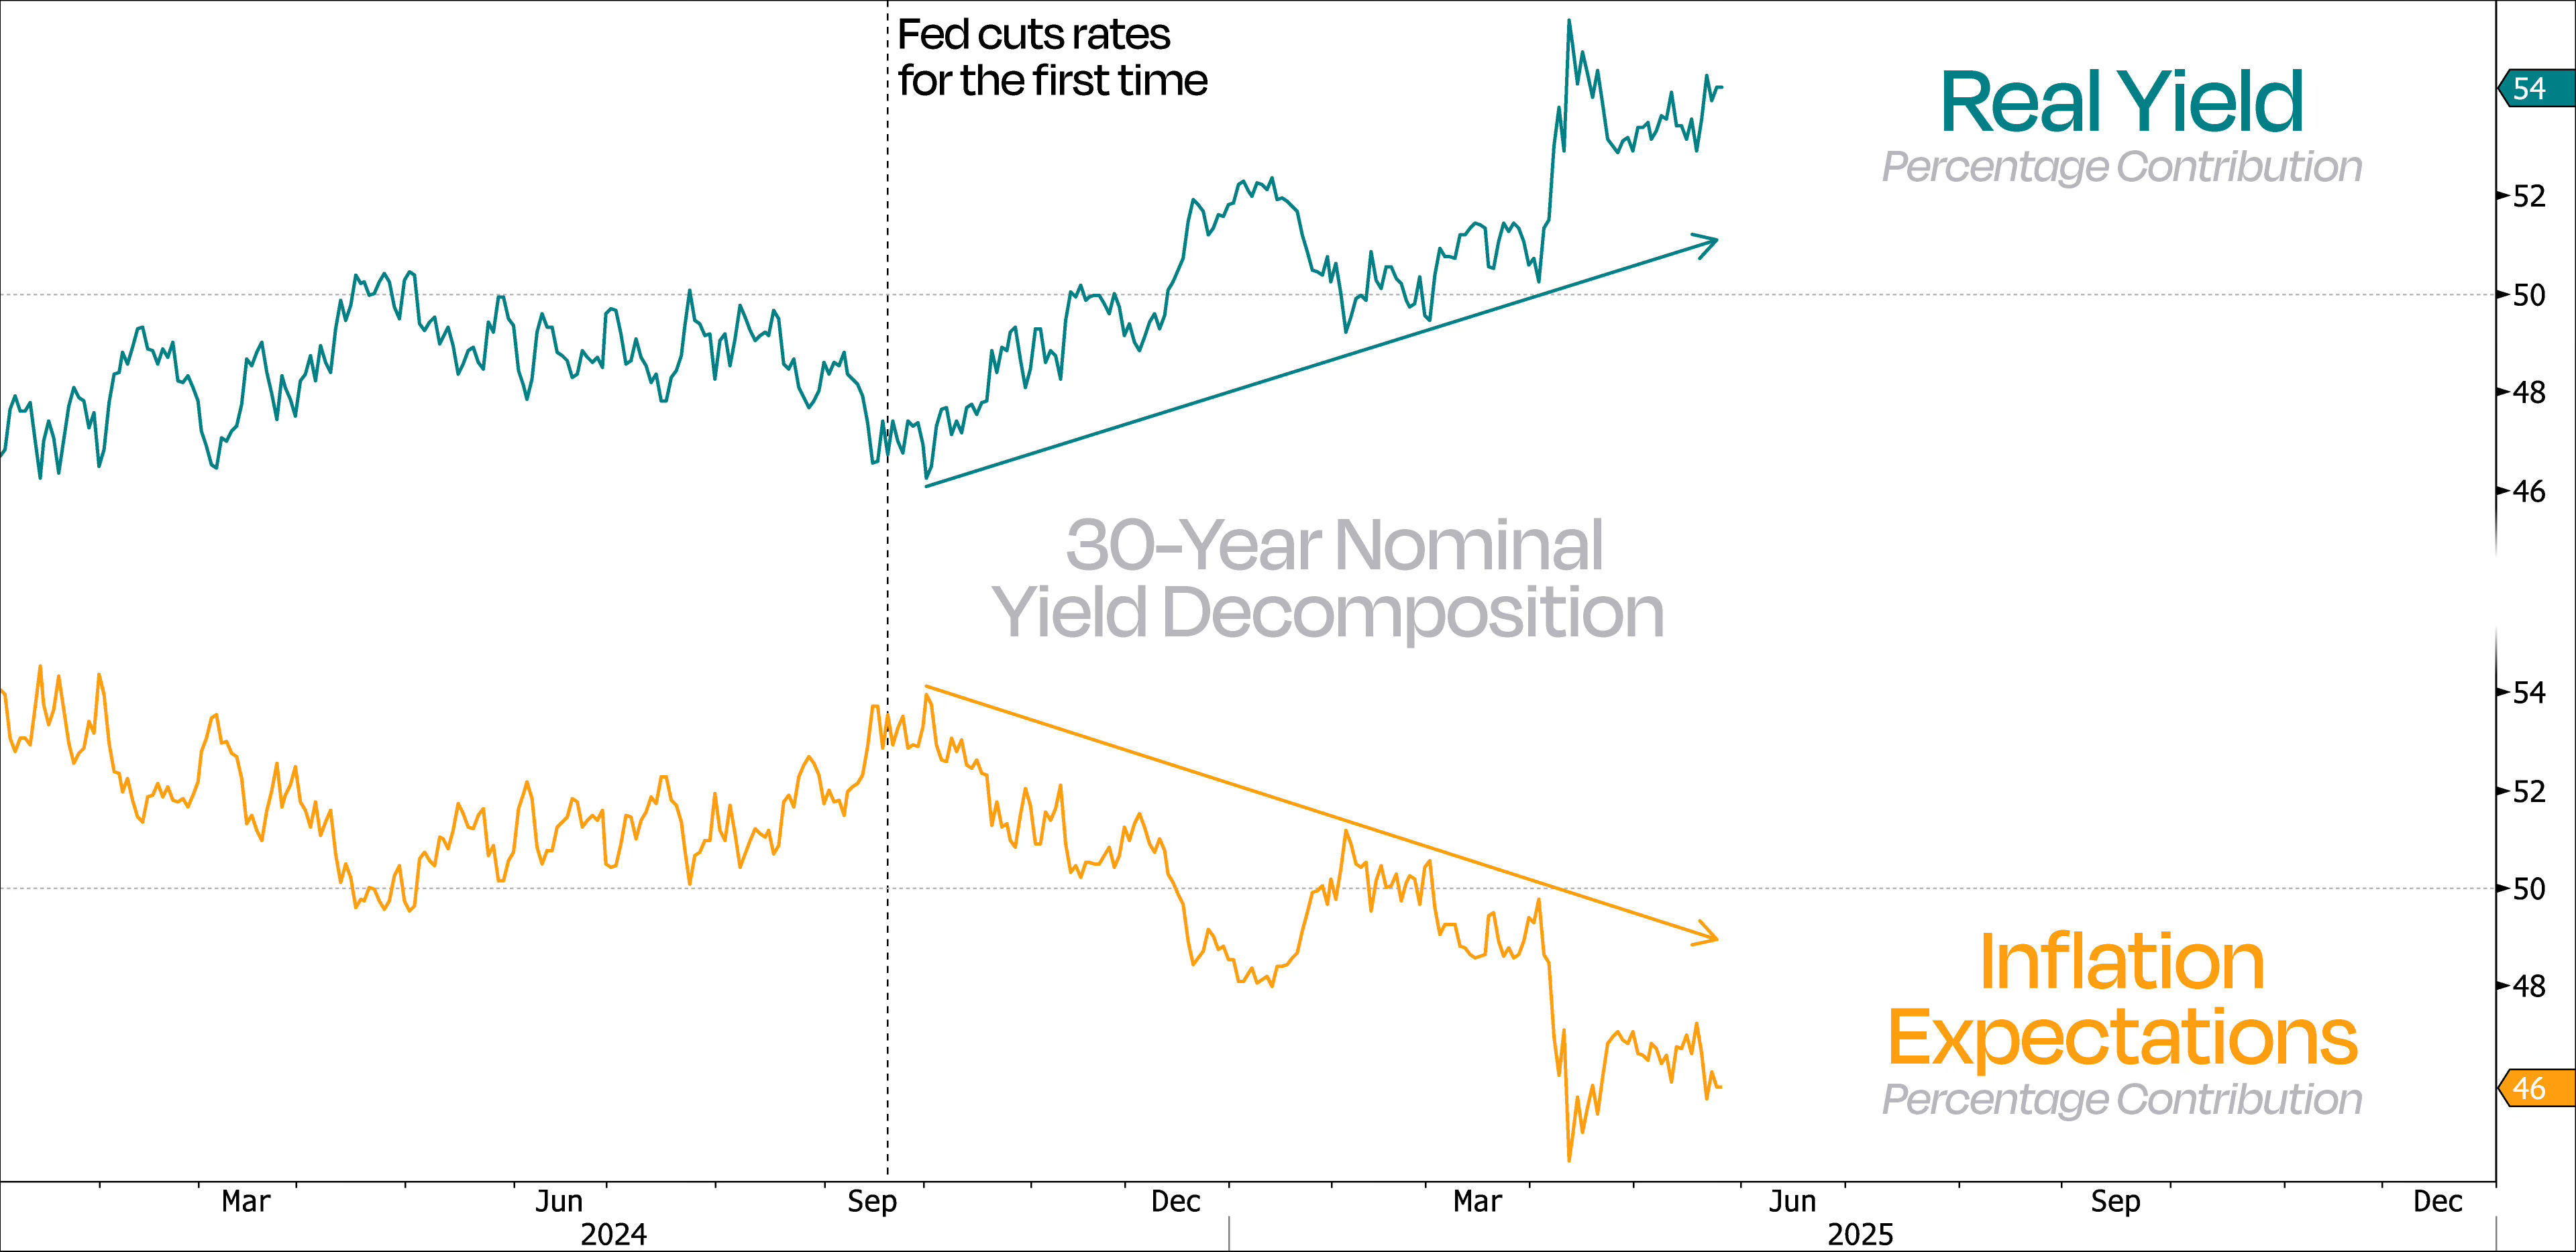
What has been moving higher are real yields. And that’s been going on since the Fed started cutting rates back in September 2024.

So no, this isn’t a case of inflation pushing nominal yields higher.
In fact, if you look at our next chart where we calculate the percentage contribution of both components to the total nominal yield, you’ll see inflation expectations have actually been losing share, while real yields have been steadily gaining ground since Q4 last year.
So, if inflation isn’t the culprit, what’s behind the rise in real yields?
From our point of view, the back end of the bond market is primarily influenced by inflation expectations and supply.
With the former staying stable, it’s the supply side that’s doing the heavy lifting – driving real yields, and therefore nominal yields, higher.
Right now, we’re seeing a handful of countries easing up on fiscal policy – even though inflation remains above target.
The US isn’t any different. Despite promises from the new administration to get spending under control, nothing’s really changing.
Even with Republicans in charge of Congress, the way things work in D.C. makes it almost impossible to get anything meaningful done.
Elon Musk seems to have figured this out too, based on his tweet over the weekend:
“I have come to the perhaps obvious conclusion that accelerating GDP growth is essential.
Well, it looks like even the head of the “Department of Government Efficiency” is realizing that the US deficit is too deep-rooted, and that perhaps the only chance the US has is explosive GDP growth.
And the bond market isn’t too happy about what this means for America’s finances.
The appetite to cut spending in Congress turned out to be way lower than even Musk anticipated.
What this means is that the long end of the curve will have a hard time catching a bid, especially since major central banks are already struggling with it.
At current levels, yields are becoming unsustainably high, and governments are going to have to think about what to do about it.
They could:
Loosen rules for banks to buy more bonds
Issue more short-term T-Bills
Or try to get countries like Saudi Arabia to buy more US bonds
But let’s be real: the Fed is most likely going to step in, buy long-end paper, and load it onto its balance sheet.
So, no matter how you slice it, it’s pretty clear we’re about to see a lot more liquidity in the system, with major central banks stepping in to deal with the crunch from all the bond issuance.
In that context, bonds – particularly on the long end – are beginning to look more attractive.
But more broadly, this whole setup is pretty market-supportive and should give risk assets a solid floor, keeping us from dipping much lower.
So yeah, while long-dated bonds might be a buy here, we’d rather lean into the global debasement trade by moving up the risk curve more aggressively.