
Short-Term Tired, Long-Term Wired
Thoughts on the Market

Short & sweet — that’s how we’d sum up last week’s trading action.
Even though the ADP number came in negative and gave the bears something to chew on, JOLTS, Challenger, and the NFP data all surprised to the upside and kept things afloat.
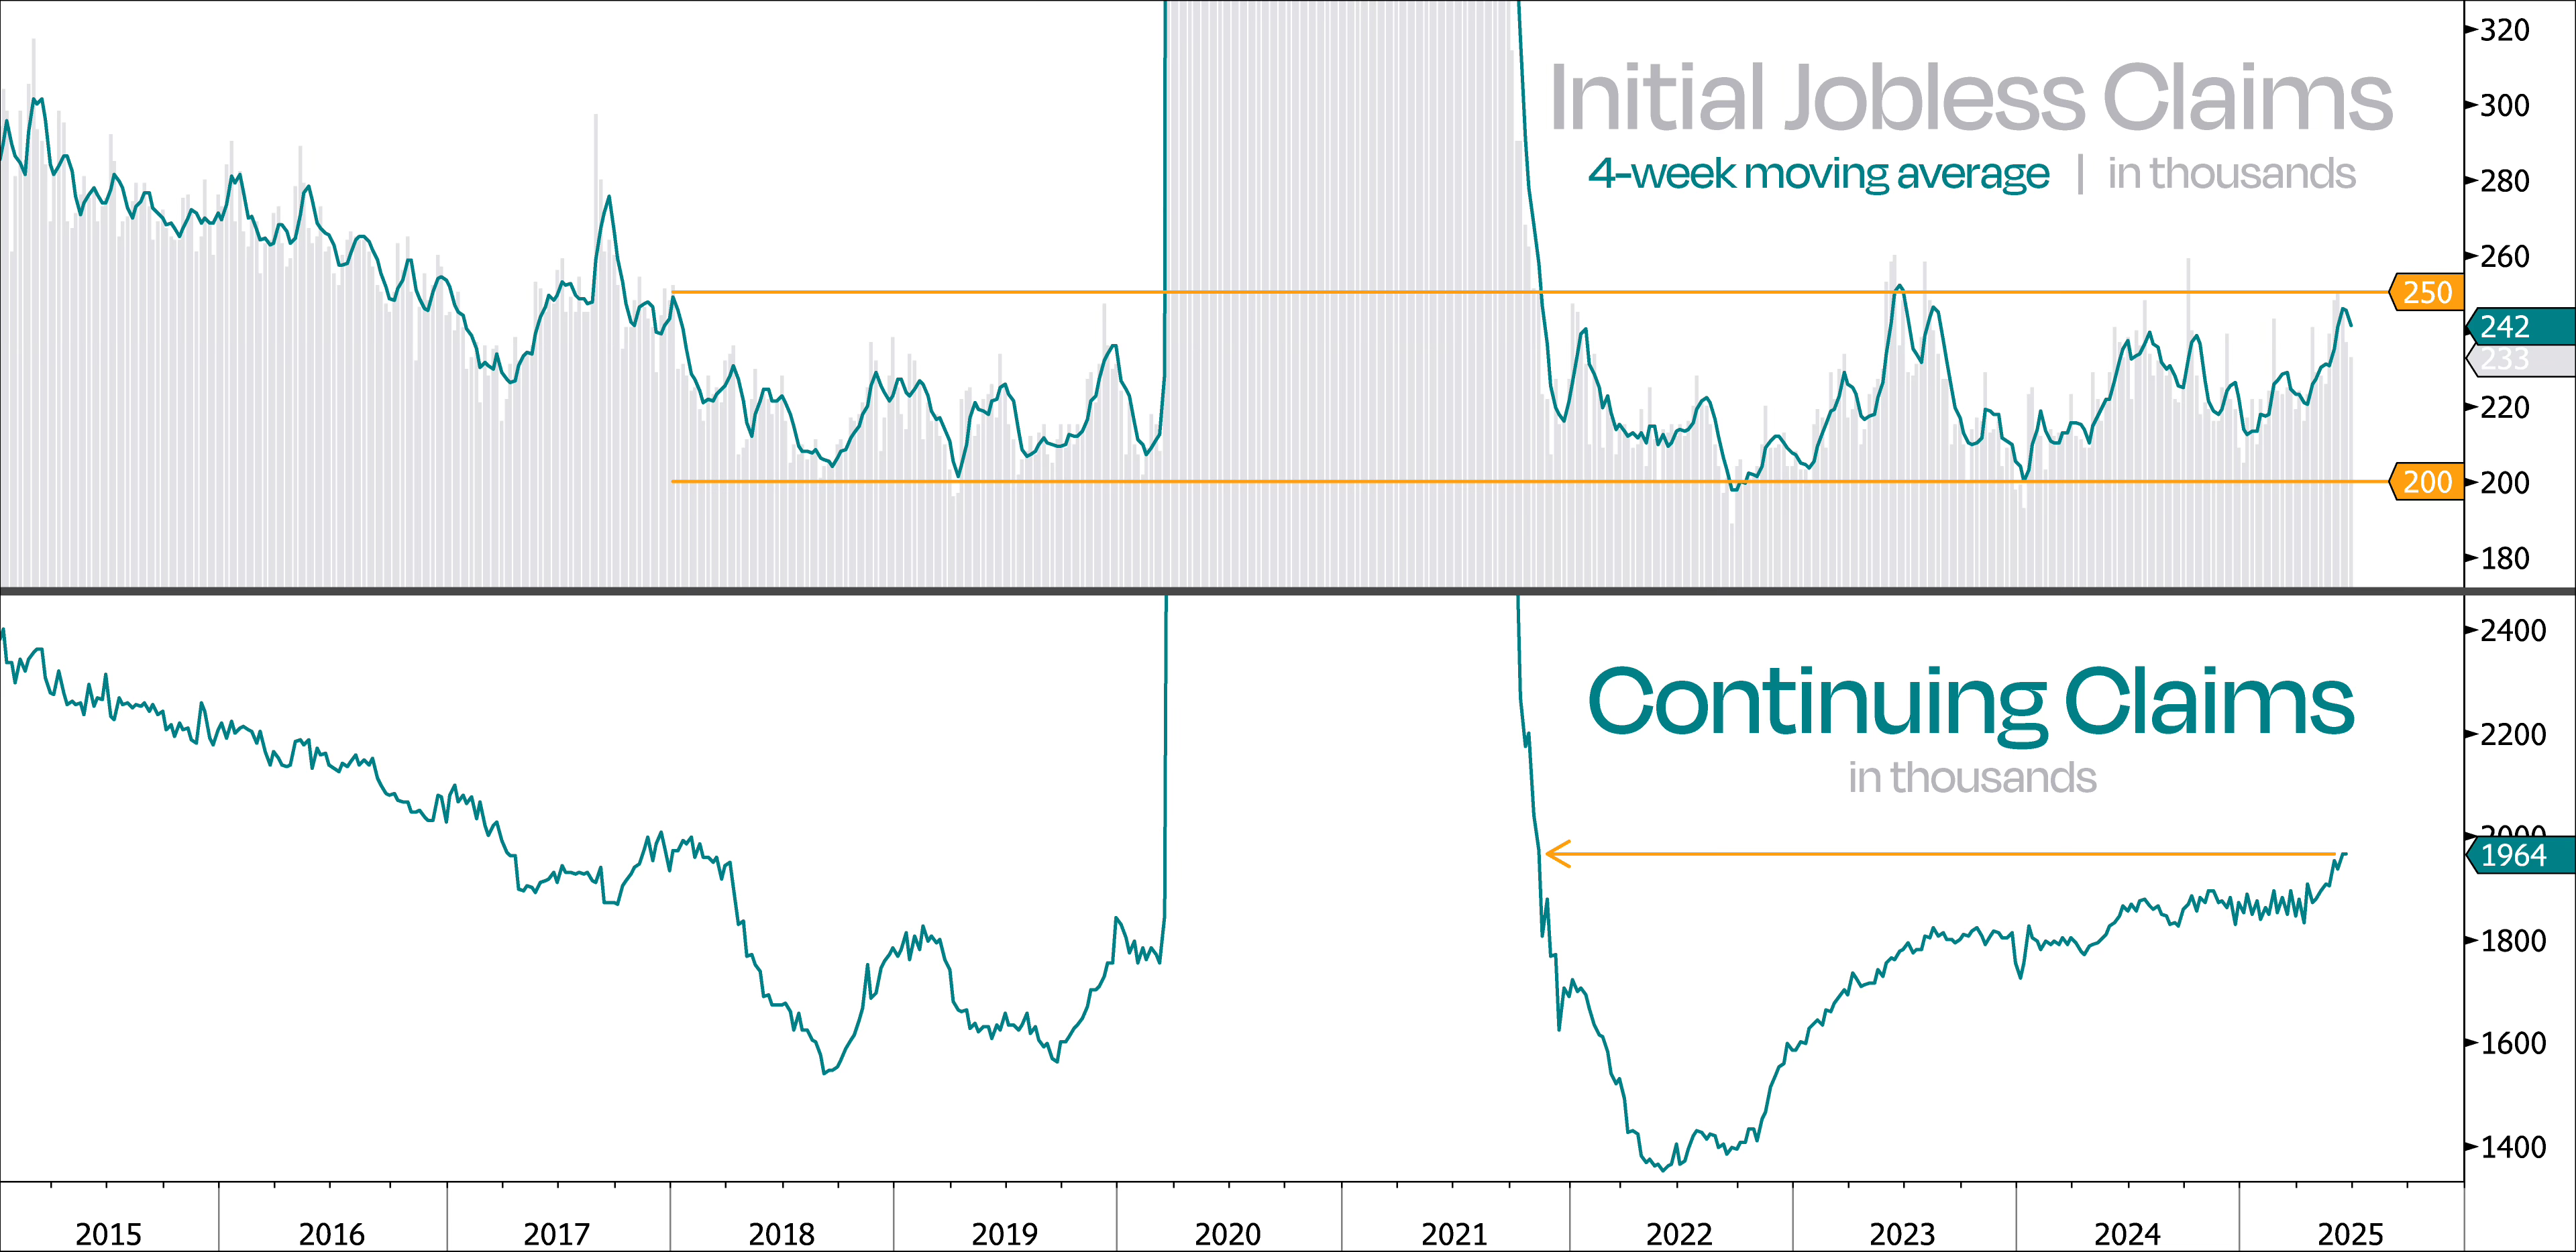
As we always say: labor market data is old news by the time it hits your screen. That’s why we focus more on the stuff that offers a more real-time view of employment trends — Weekly Jobless Claims and Continuing Claims.
So, taking a look at our first chart today, here’s what stands out:
Jobless Claims are still sitting in a healthy range (200k–250k)
Continuing Claims continue to rise
Bottom line: hiring is cooling, but layoffs aren’t picking up.
In short, no major changes on that front — so let’s move on.
Just like we expected, the S&P 500 formed a golden cross — a technical signal that adds yet another tailwind to the ongoing rally. With 6 out of 11 sectors now showing their 50-day moving averages trading above their 200-day, trend conditions continue to strengthen.
Meanwhile, we closed out Q2 with a bang — up +10.6% — after the rough Q1 shaved -4.6% off the index. Like Ryan Detrick says, the “slingshot is in play.” Whenever Q1 is down but Q2 jumps 10% or more, the last six months usually see an average gain of about +16% — way better than the typical +4.8% for the rest of the year.
Now that H1 is behind us, investor focus is shifting to 2026 earnings estimates. So, slap a 22x multiple on $300 earnings, and you’re looking at about 6600 on the S&P 500 — right around where Wall Street had their ‘25 targets by the end of last year, before they blinked. But since most pulled back their targets to around 6060, they’ll probably just keep chasing the index higher. Classic — and so much for forecasting…
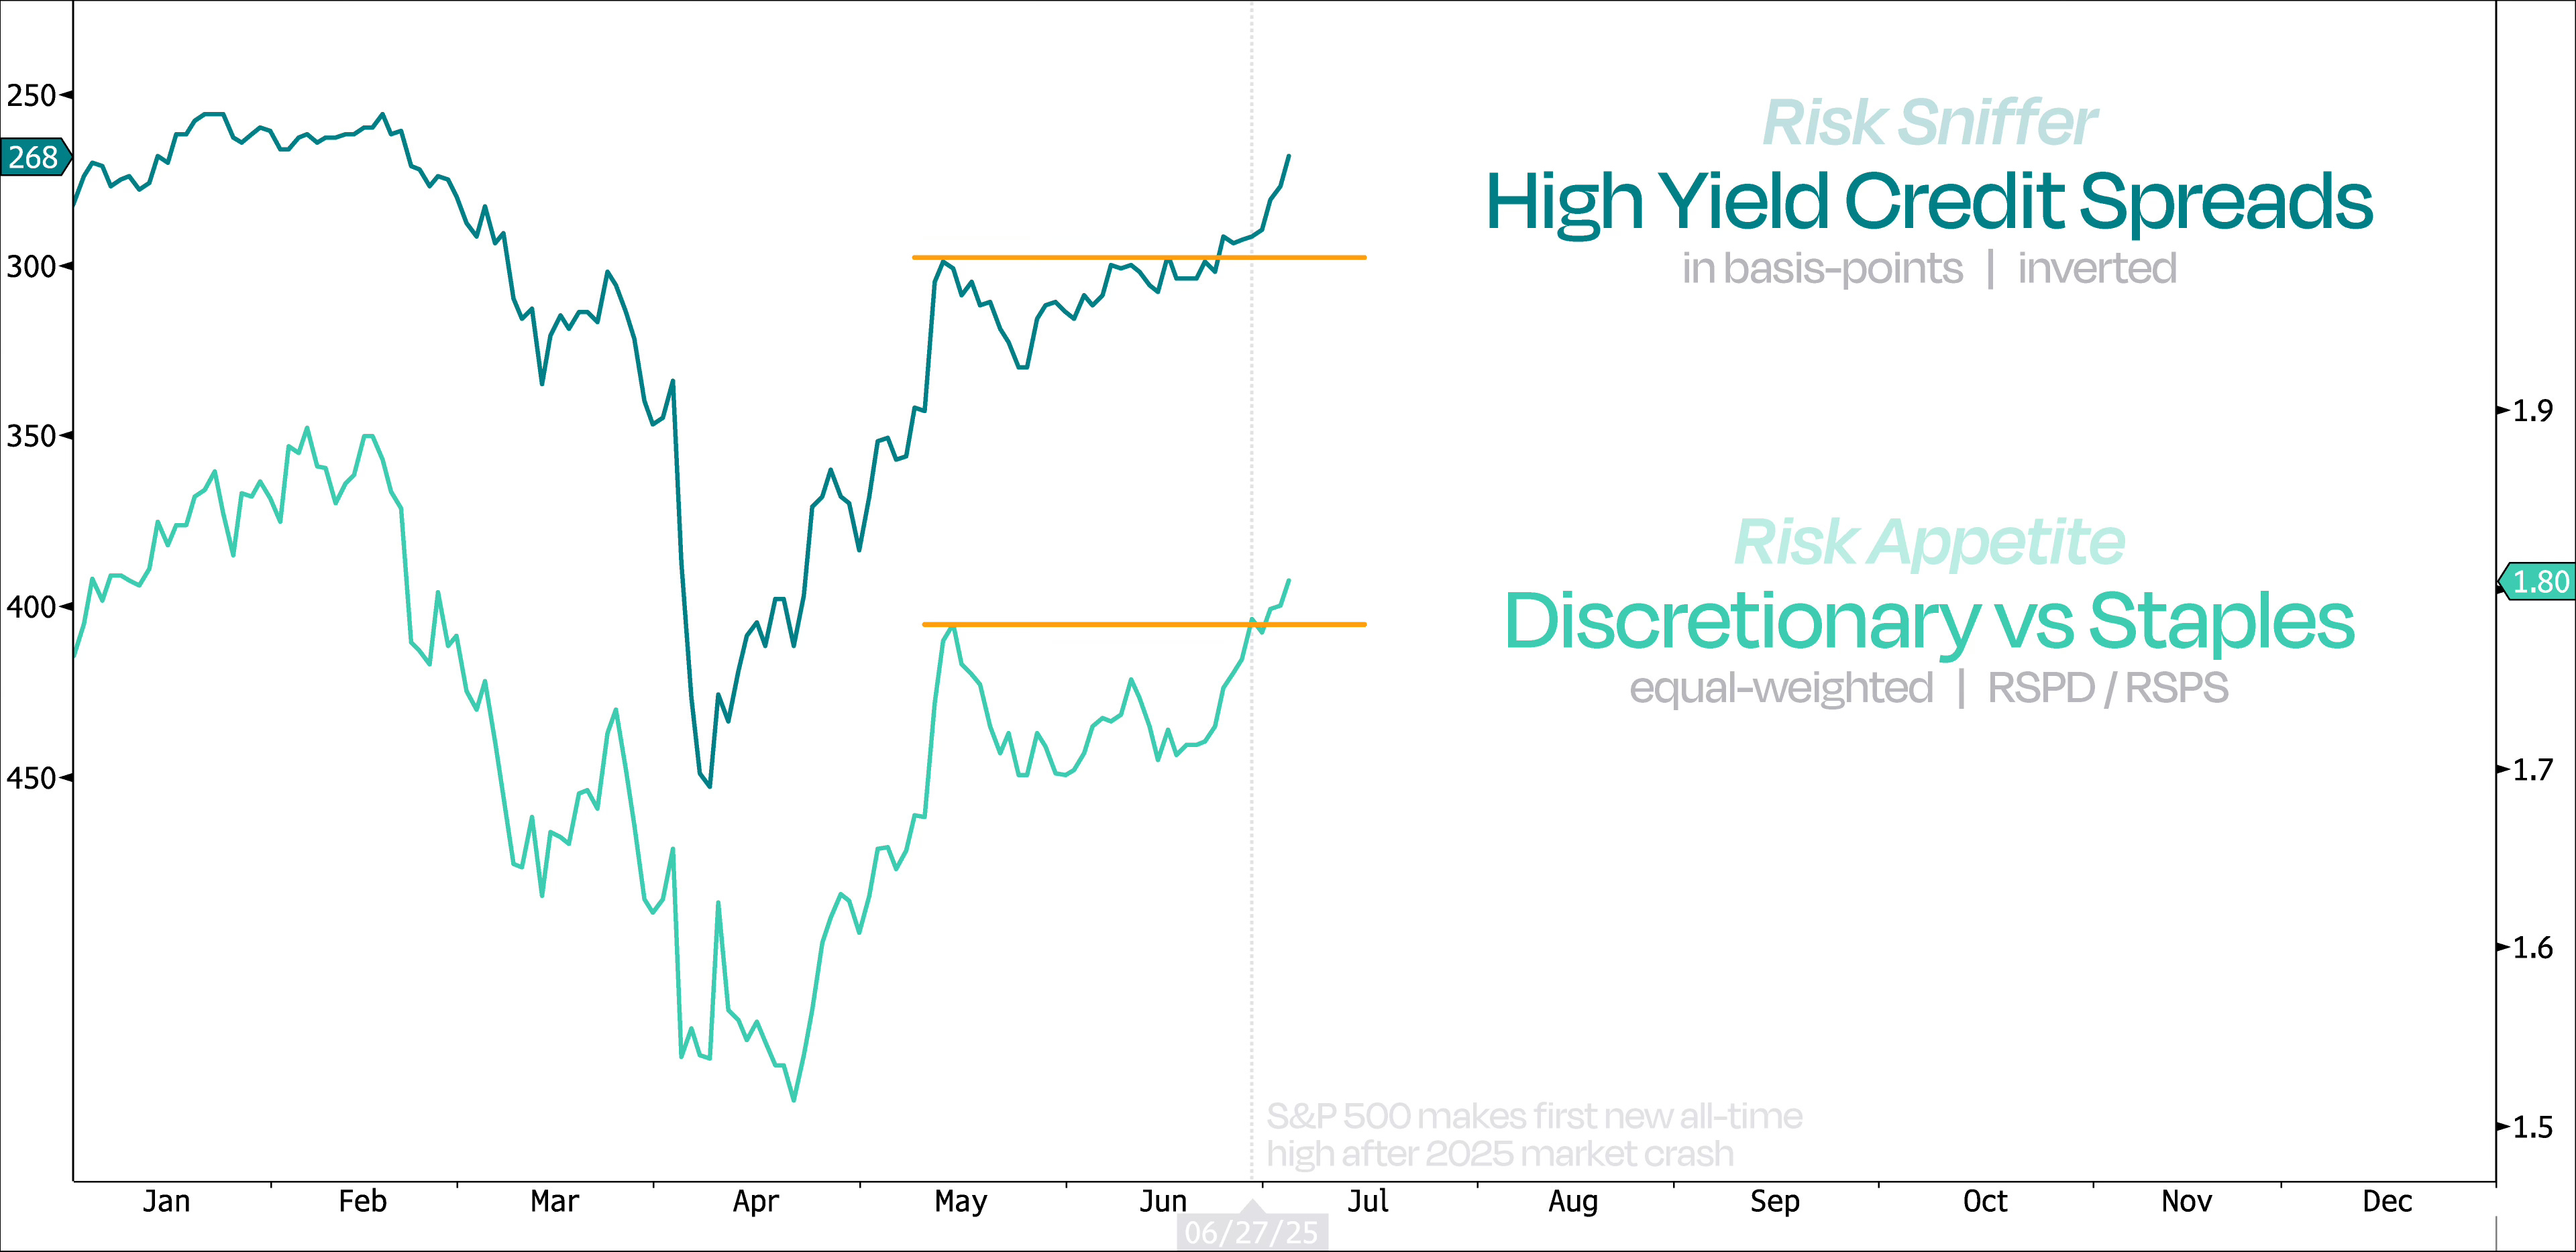
Looking at our go-to risk appetite gauge — Discretionary vs Staples — and listening to the best risk sniffers in the market — credit investors — suggests the chase is just beginning, as the chart below is telling us to buy stocks, not sell.
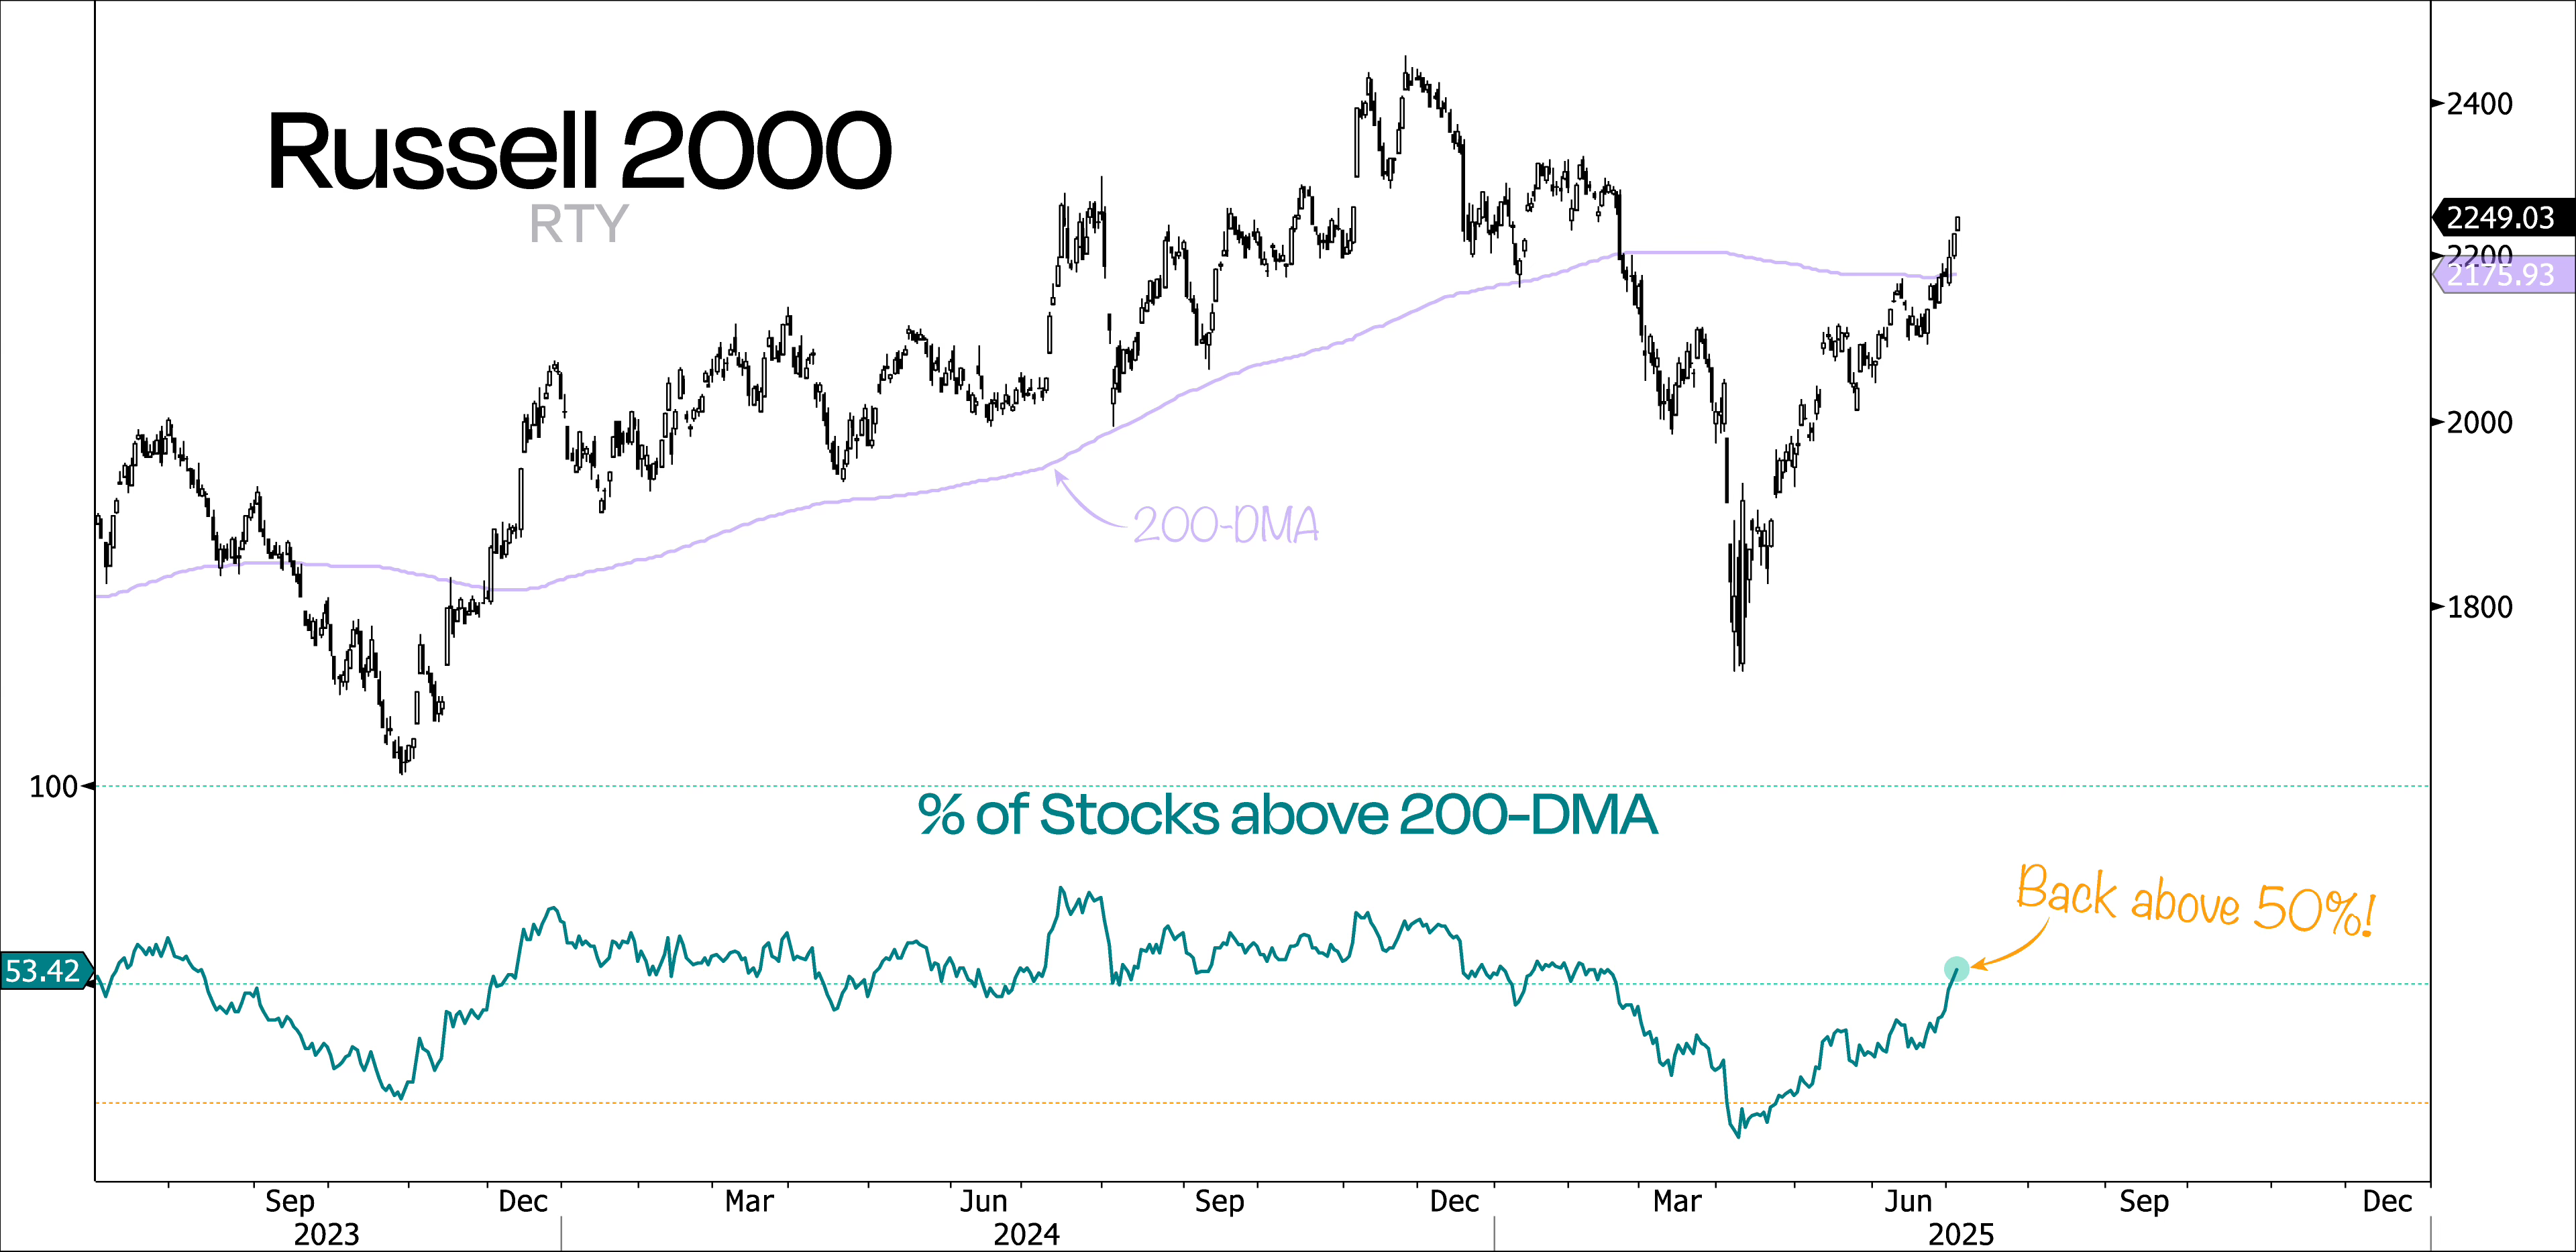
Another positive for risk: small-caps have finally moved above their 200-day moving average, joining mid- and large-caps. That’s a positive shift across all size tiers.
On top of that, over 50% of Russell 2000 stocks are now trading above their own 200-DMA, which points to improving breadth.
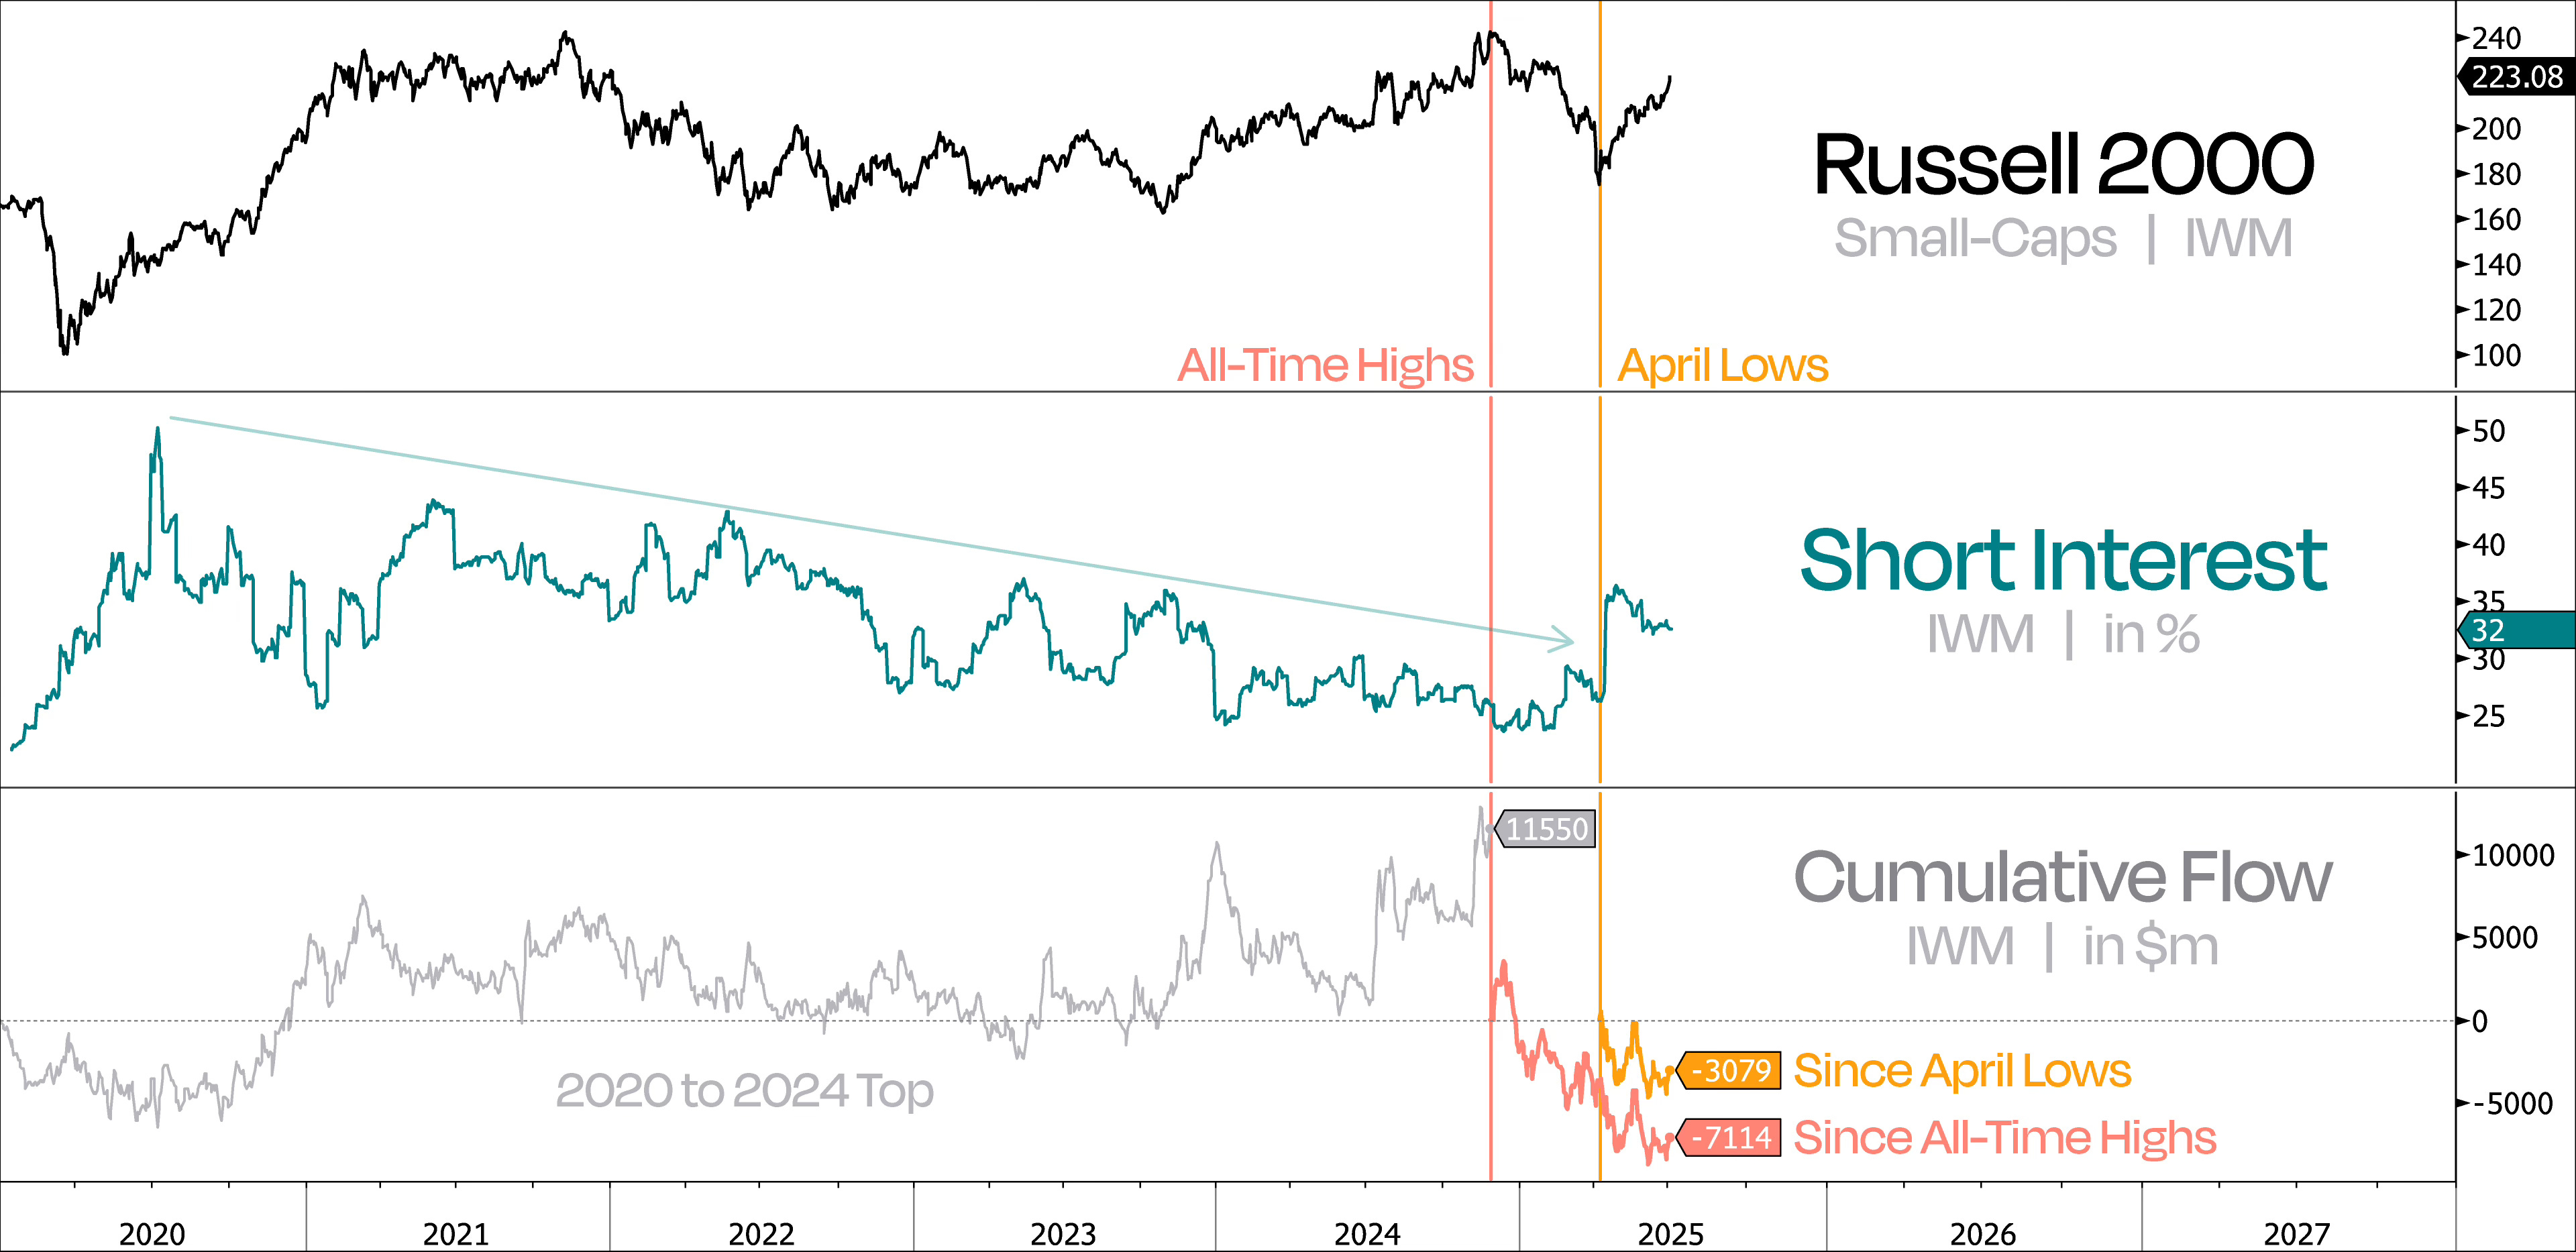
From a positioning standpoint, small-caps still look like they have room to run. Investors remain underexposed, continuing to pull money out despite the huge rally since the April lows.
Meanwhile, there are still a lot of folks stuck on the wrong side of the trade with shorts. Even though short interest has come down a bit, it’s still elevated — and that’s fuel for a squeeze.
All of this makes the current setup pretty compelling for a trade. But let’s be honest — every “buy small-caps now” call over the past few years has aged like milk, so we want to be smart about risk.
The good news is that small-caps are sitting right at a key level relative to the S&P 500. If that ratio breaks out, that’s your signal to lean in and pick up some IWM. Just make sure you’ve got clear stops in place.

Now, this rally isn’t just spreading across different market caps — it’s picking up steam across sectors too. The S&P 500 just logged the most stocks above their 200-day moving average since January. And fun fact: only two days this year have posted stronger participation.
We’re also back to 8 out of 11 sectors trading above their 200-DMA, and this snapshot from our Technical Dashboard shows just how strong the S&P’s internals are right now.

That said, market breadth is clearly improving and looking pretty healthy. We’re even seeing the cumulative NYSE advance-decline line hit new all-time highs — the first since late November.
But of course, no good news comes without some pushback. This time, the skeptics are claiming weak breadth, thin participation, and the usual gripe that it’s just the mega-caps dragging the index higher. Their proof? The S&P 500 keeps hitting new highs, but not many stocks are tagging new 52-week highs.
We think that view misses the bigger picture. It’s not that breadth is bad, but rather a function of market structure and timing.
Keep reading with a 7-day free trial
Subscribe to Duality Research to keep reading this post and get 7 days of free access to the full post archives.