
The Charts Are Telling Us Things Are About to Accelerate
Thoughts on the Market

Not much has changed — it’s still a bull market. And as is often the case in bull markets, prices keep climbing even when not much seems to be happening.
With the US Government in shutdown, we didn’t get to update our Labor Market Recovery chart for September. Not even weekly claims came through.
Luckily, though, not everything runs through D.C.
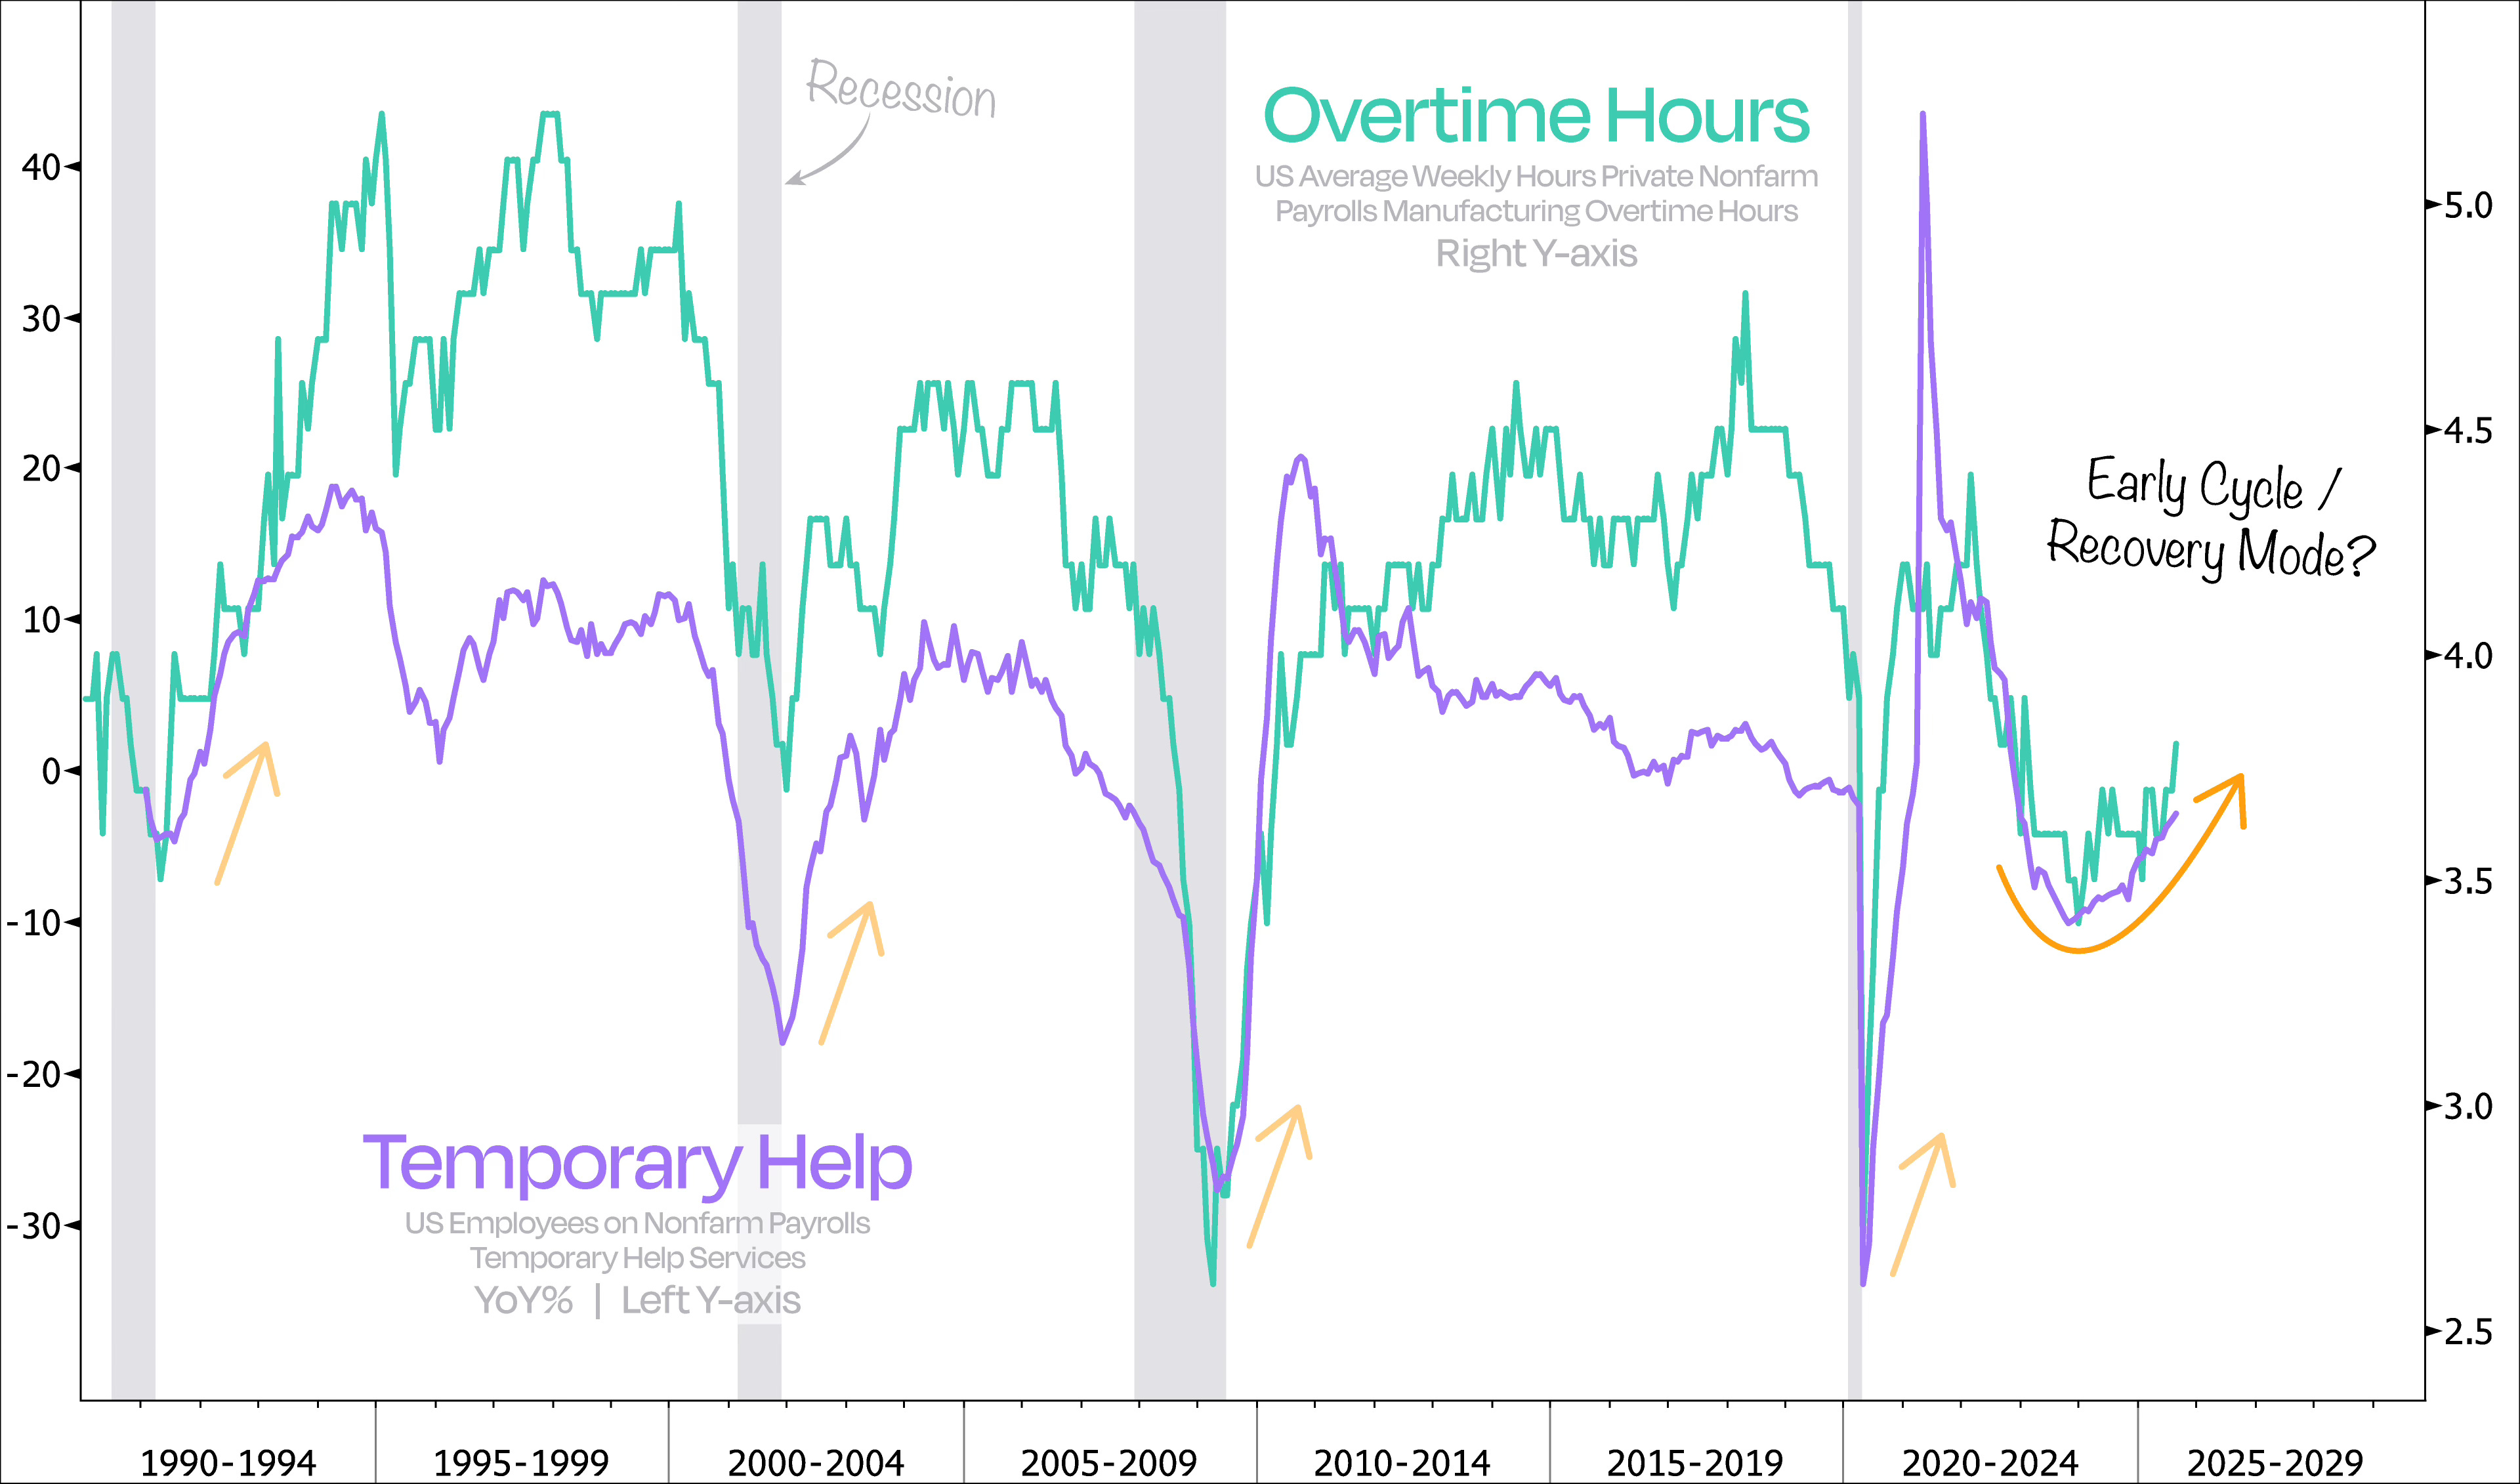
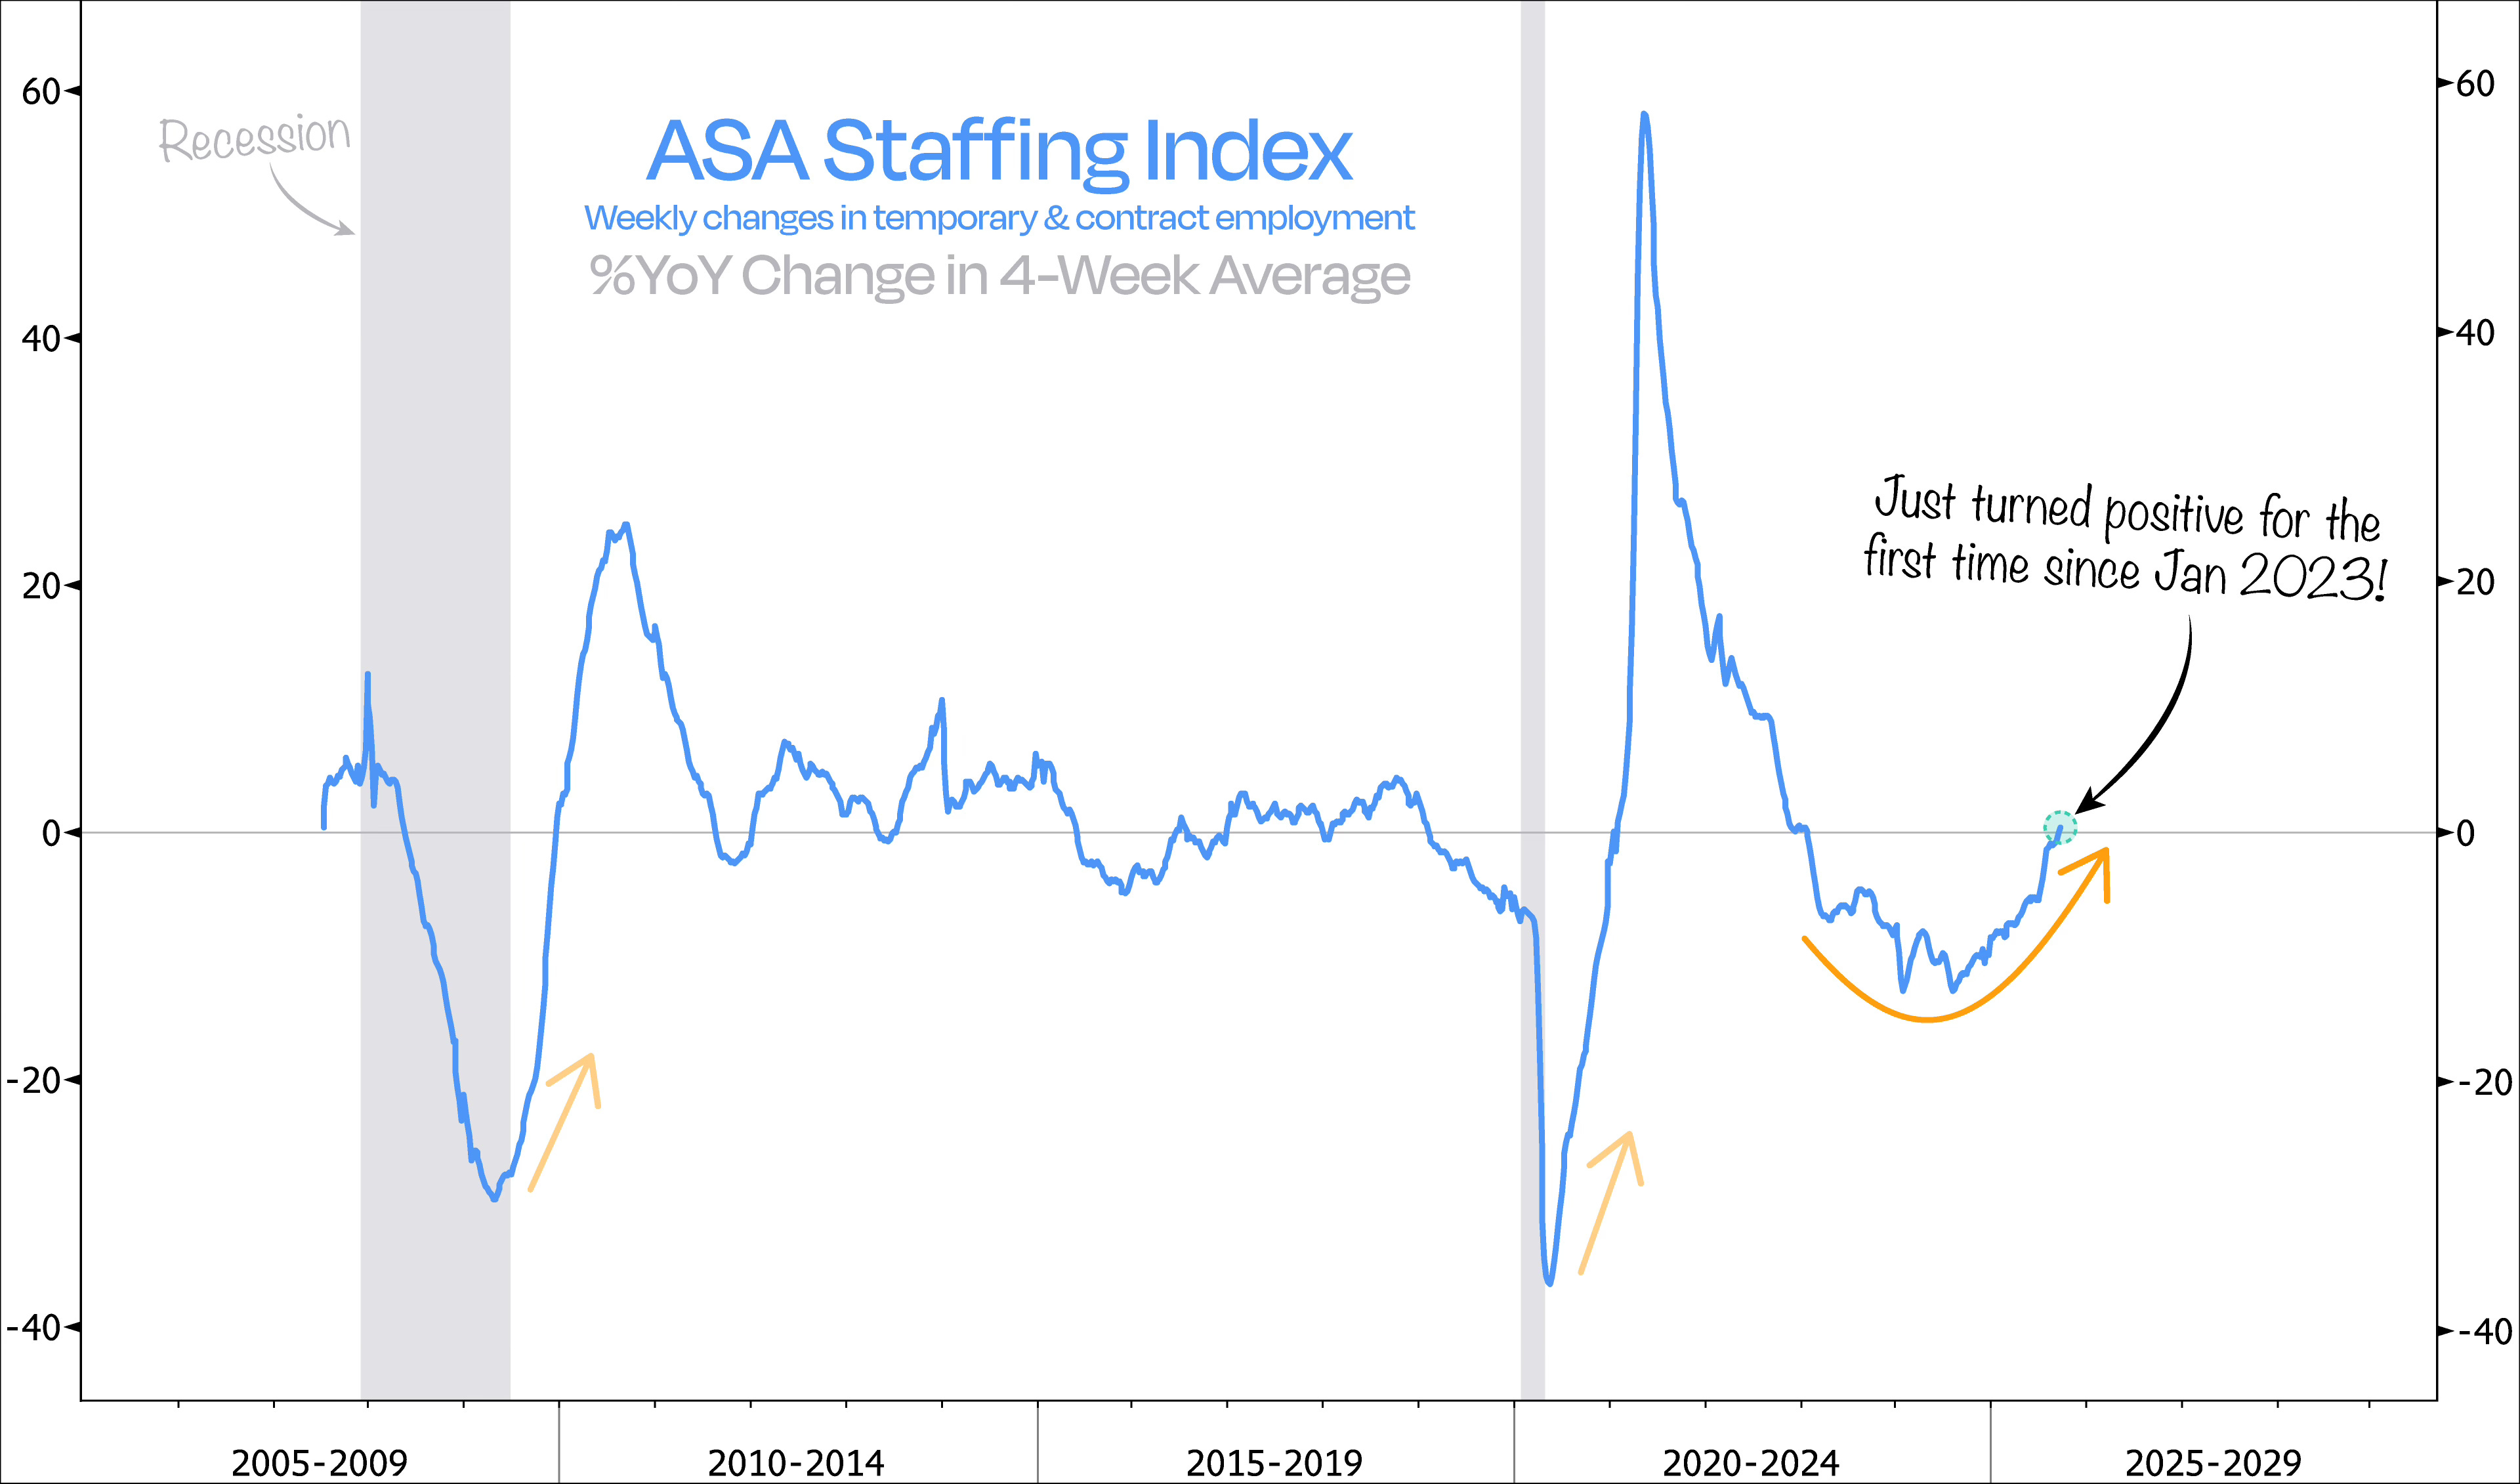
We turned instead to the American Staffing Association (ASA) Index, which tracks weekly shifts in temporary and contract employment. And like Overtime Hours or Temp Services, it works as a leading indicator for where Nonfarm Employment (and the broader economy) might be headed.
What makes the ASA Staffing Index particularly noteworthy right now is that it hasn’t just mirrored the recent reversals we’ve seen in those other indicators — its 4-week average just turned positive year-over-year for the first time since January 2023.
Readers of Duality Research already know what this means: the Fed looks ready to ease hard into a recovery. And that only points us in one direction — further out on the risk curve.
Think small-caps, crypto, anything with a higher beta.
That usually comes hand-in-hand with a broadening market. And what drives that broadening? The weight of rates finally coming off the ISM.
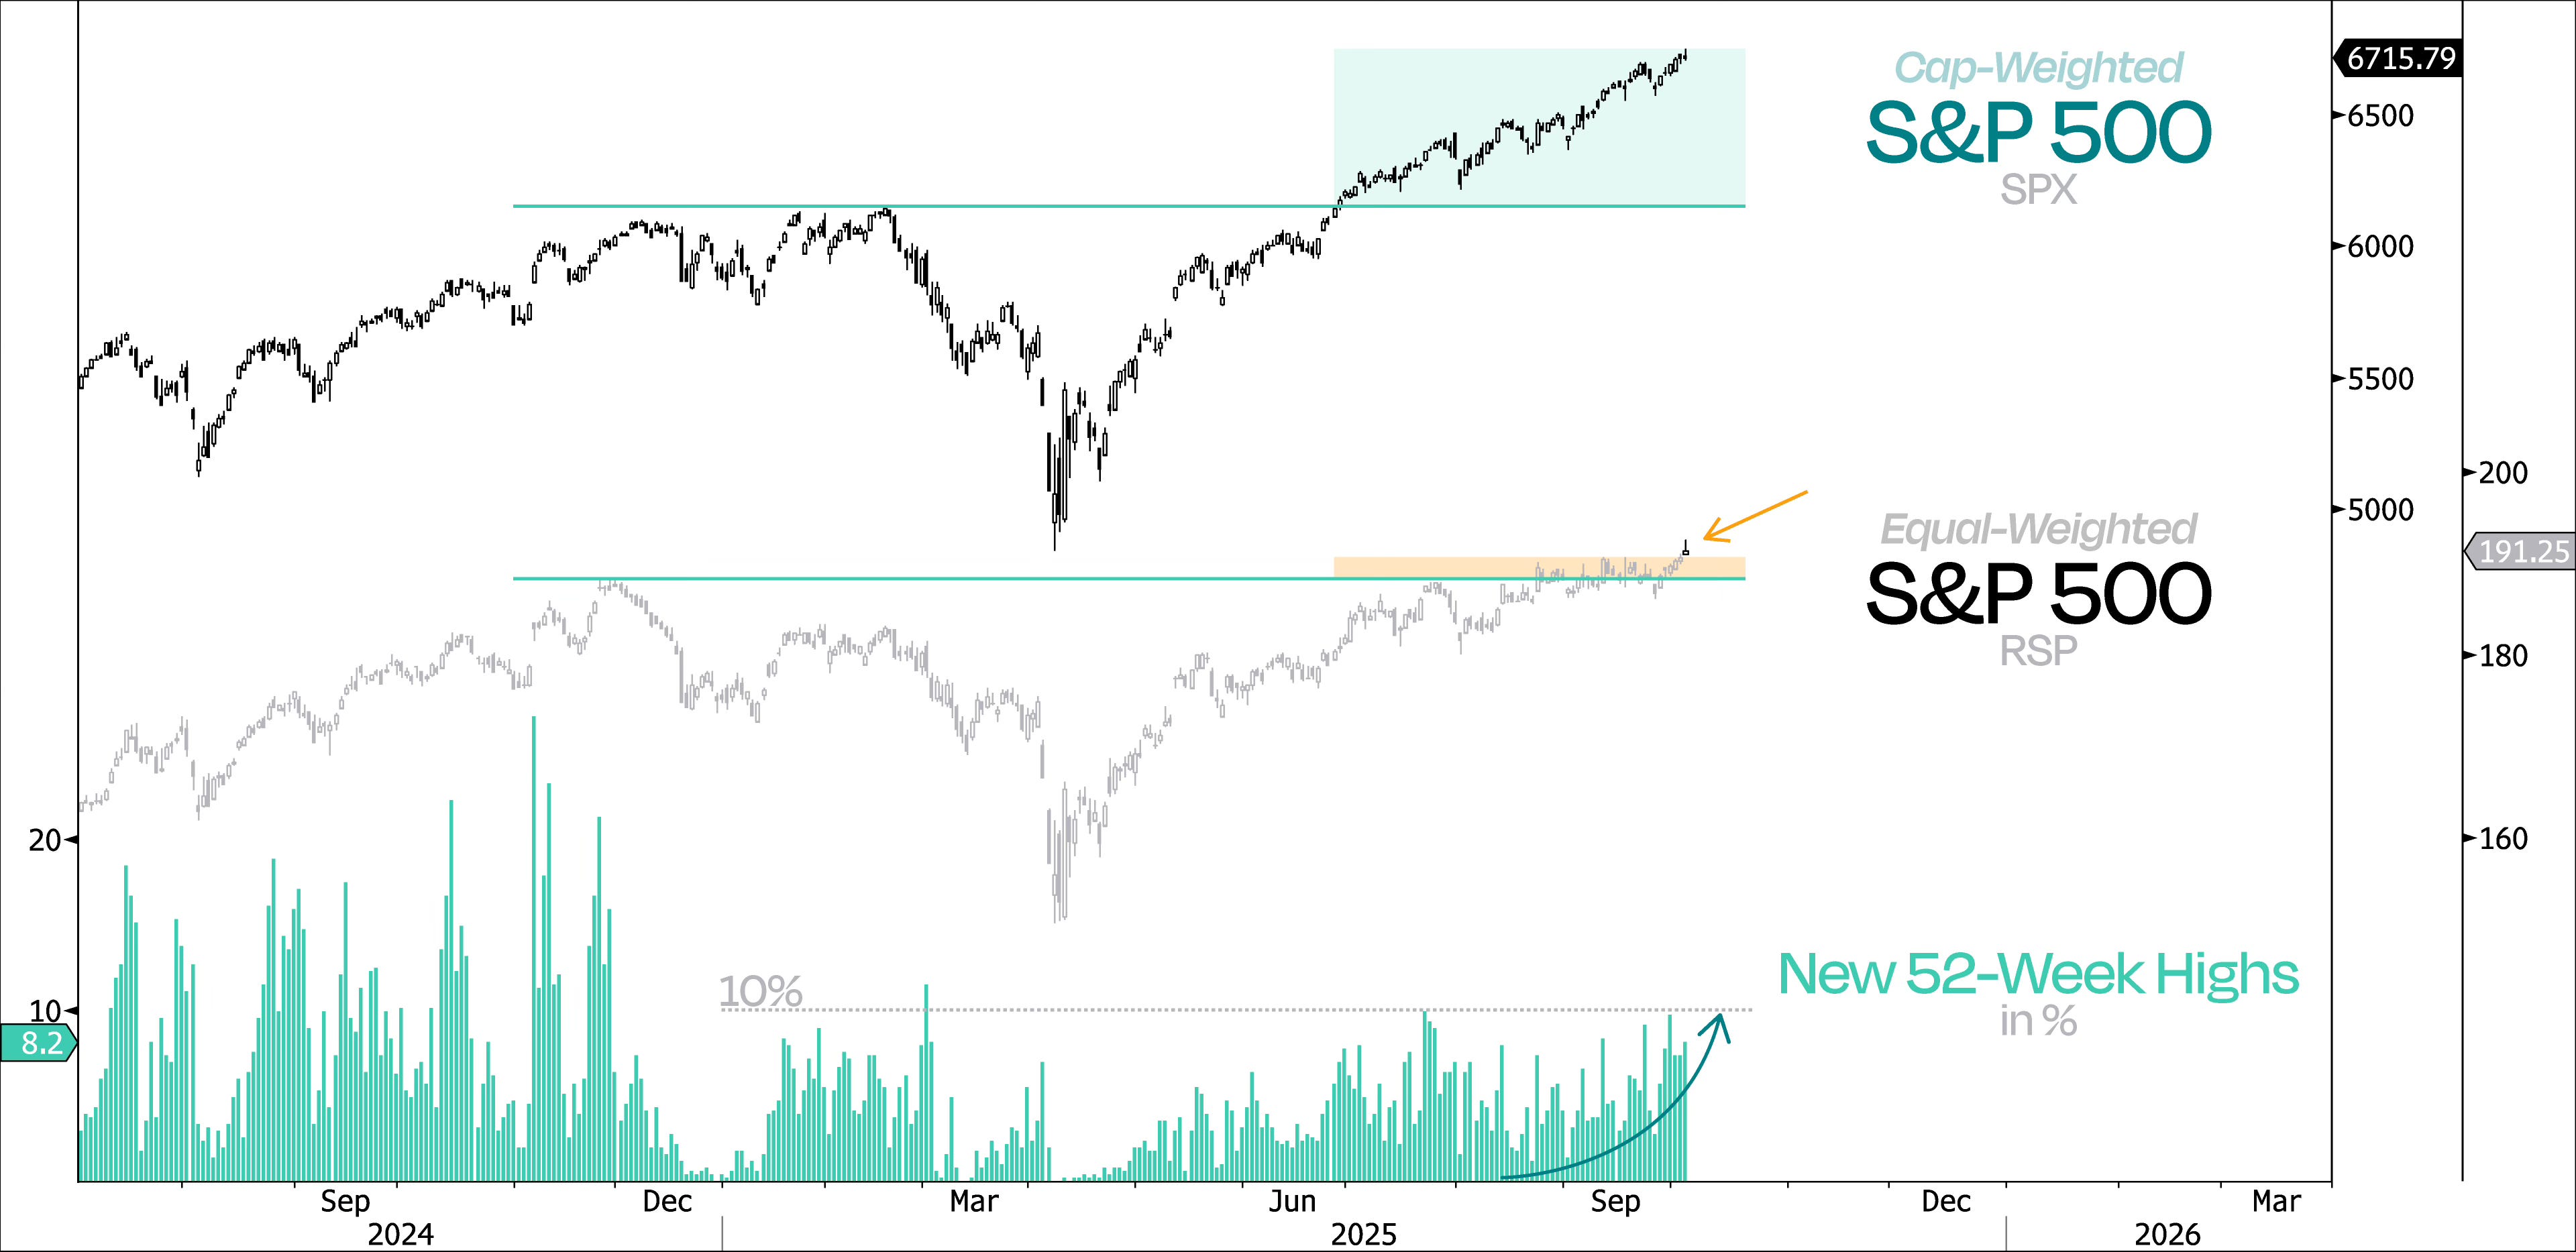
Take a look at this next chart showing the S&P 500 on both a cap- and equal-weighted basis, along with the percentage of stocks hitting new highs.
While the cap-weighted index ripped to fresh highs in June and never looked back, the average S&P stock has been stuck in a 2-month consolidation.
Last week, however, that changed — the equal-weight S&P is finally starting to move again. And if that keeps up, the list of stocks hitting new 52-week highs should start expanding.
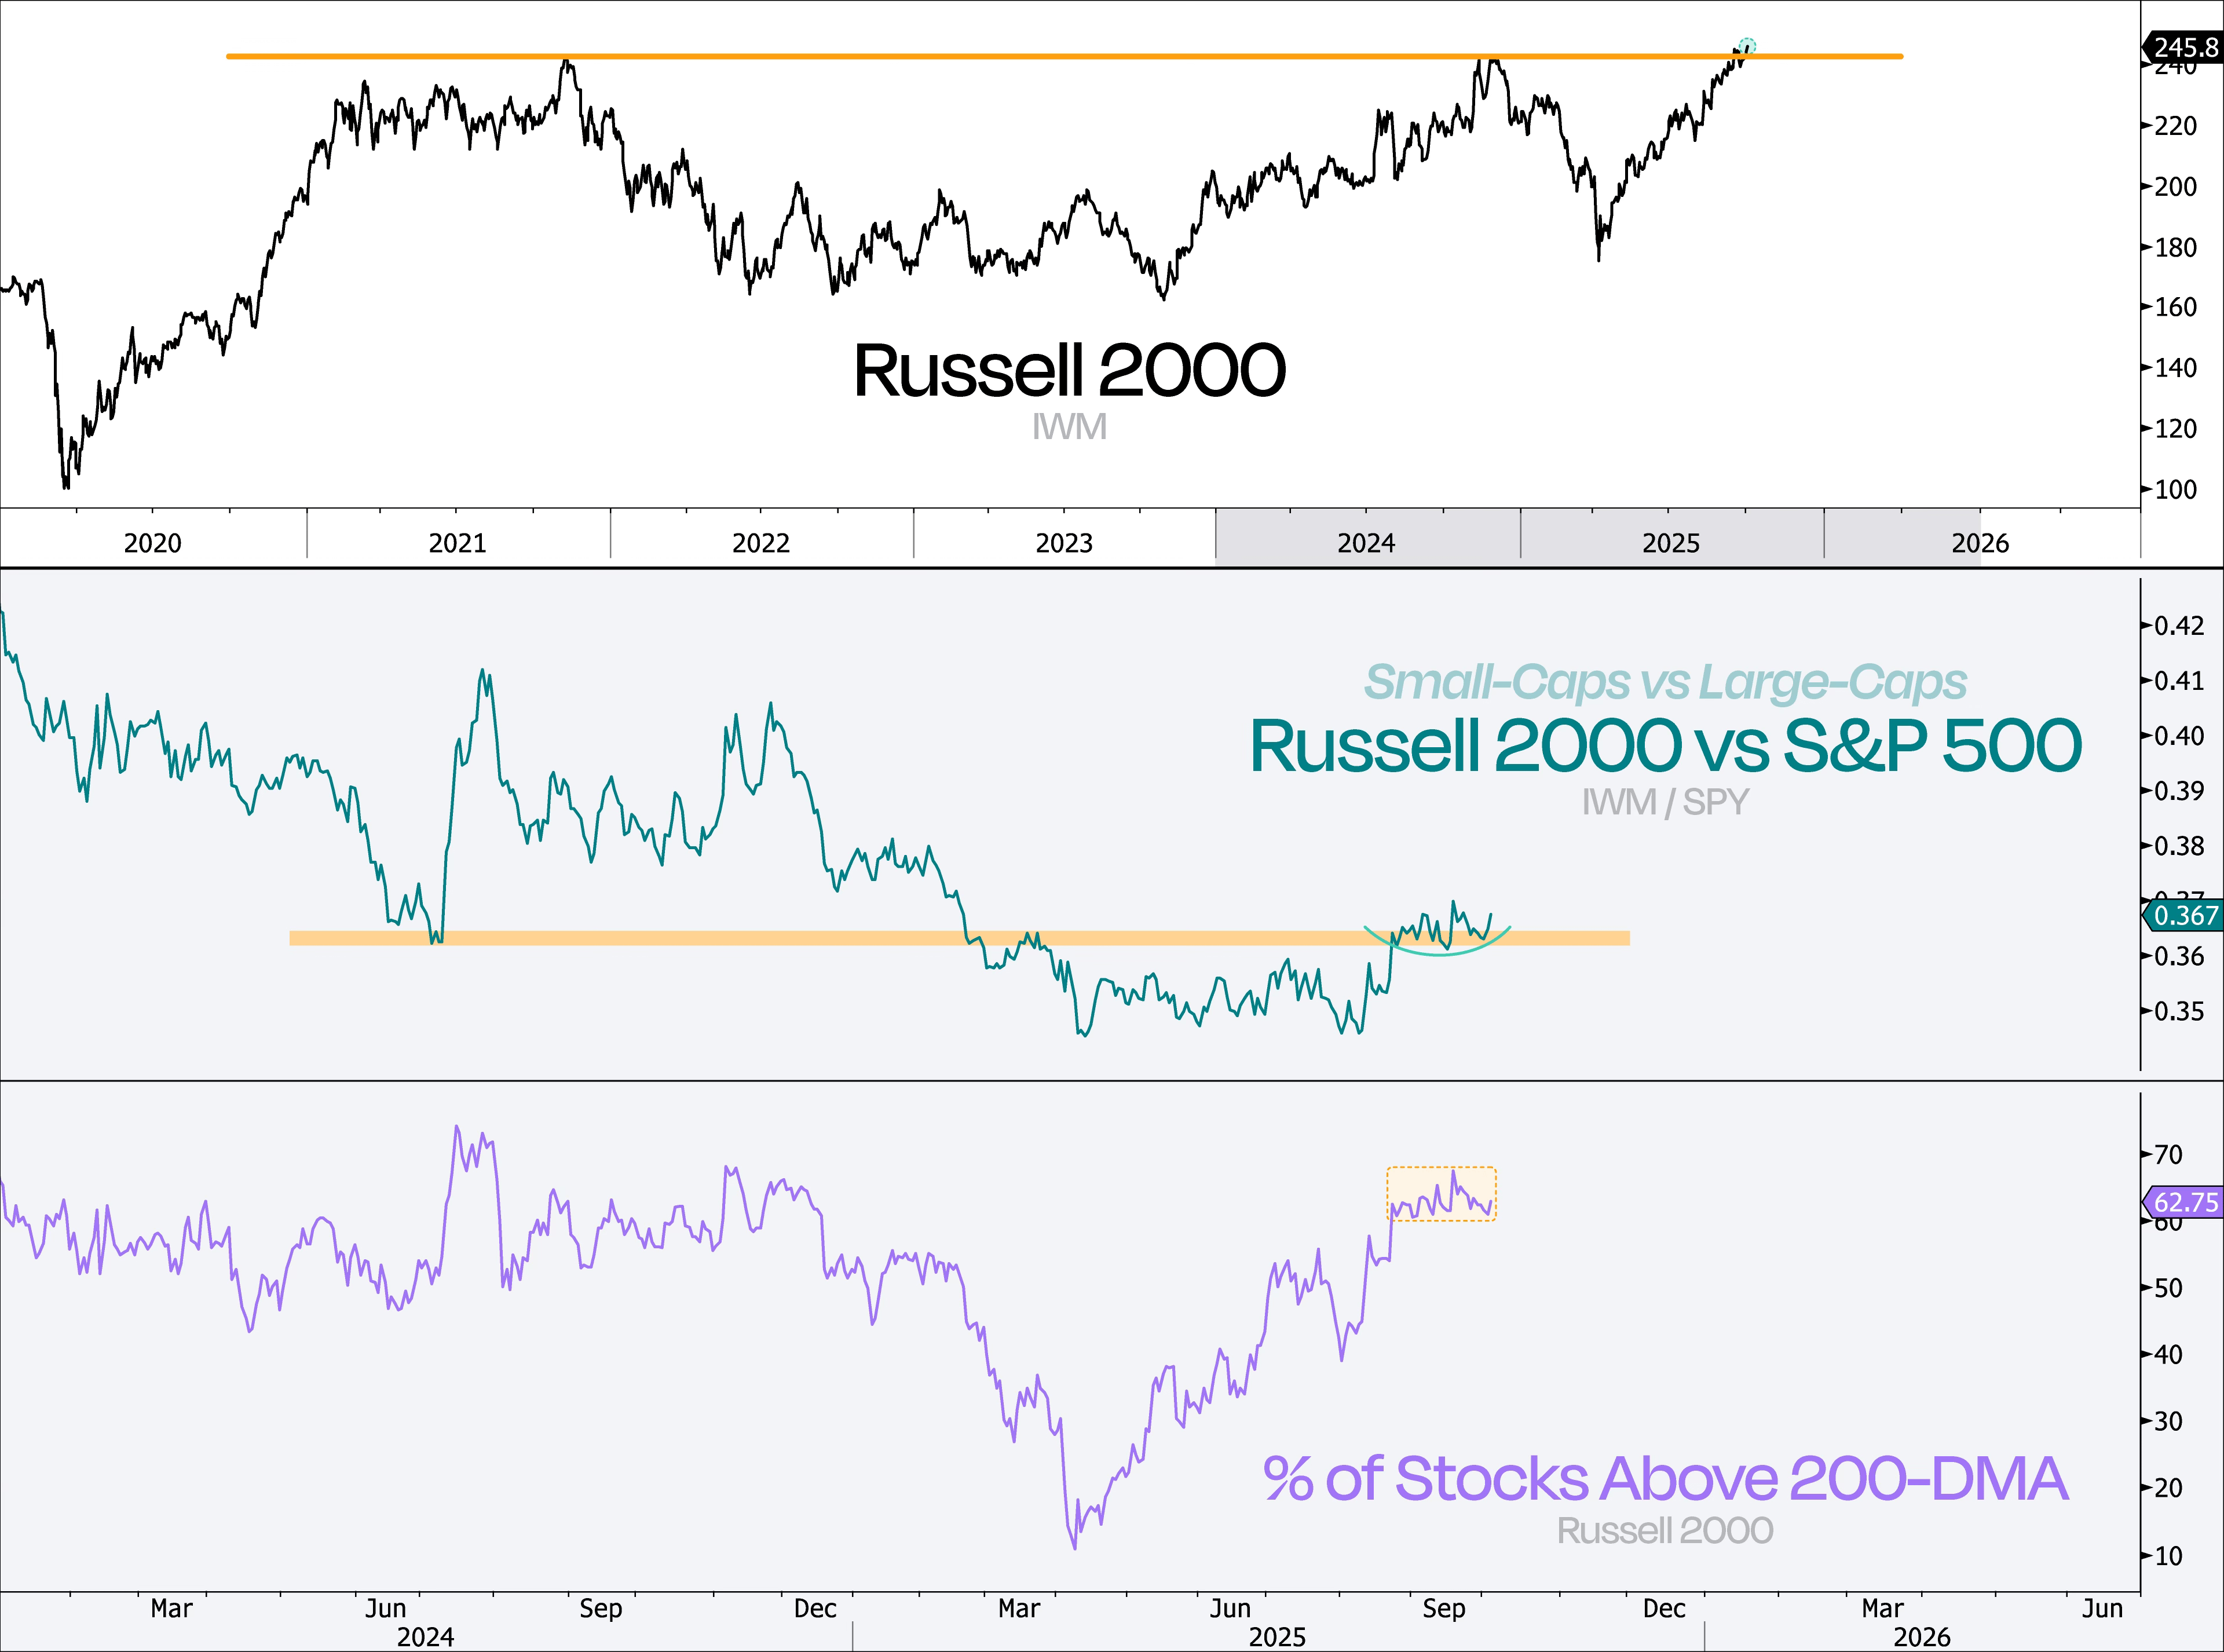
One corner of the market we’ve been flagging amid this broadening-out trade is small-caps.
They haven’t really broken out against large-caps yet, but it’s pretty telling that the Russell 2000 has managed to keep pace with the S&P 500 lately — even without decisively clearing its prior highs.
Once small-caps finally put that 4-year base behind them, we believe the Russell 2000 could deliver some serious alpha for patient investors.
Look at the chart since 2020 — it’s basically telling us things are just about to accelerate.
Like we said earlier, moving down the risk spectrum usually comes with a broadening market. But you’d think, based on the chatter, that the mega-caps are back in charge — perhaps fueled by Apple’s recent rally or NVIDIA’s breakout to new highs.
Truth is, over the past two months, the Magnificent 7 have actually been trailing an equal-weighted basket of Technology, Discretionary, and Communication Services.
To put numbers on it: they’re about 4% behind the average performance of 142 stocks over the last eight weeks.
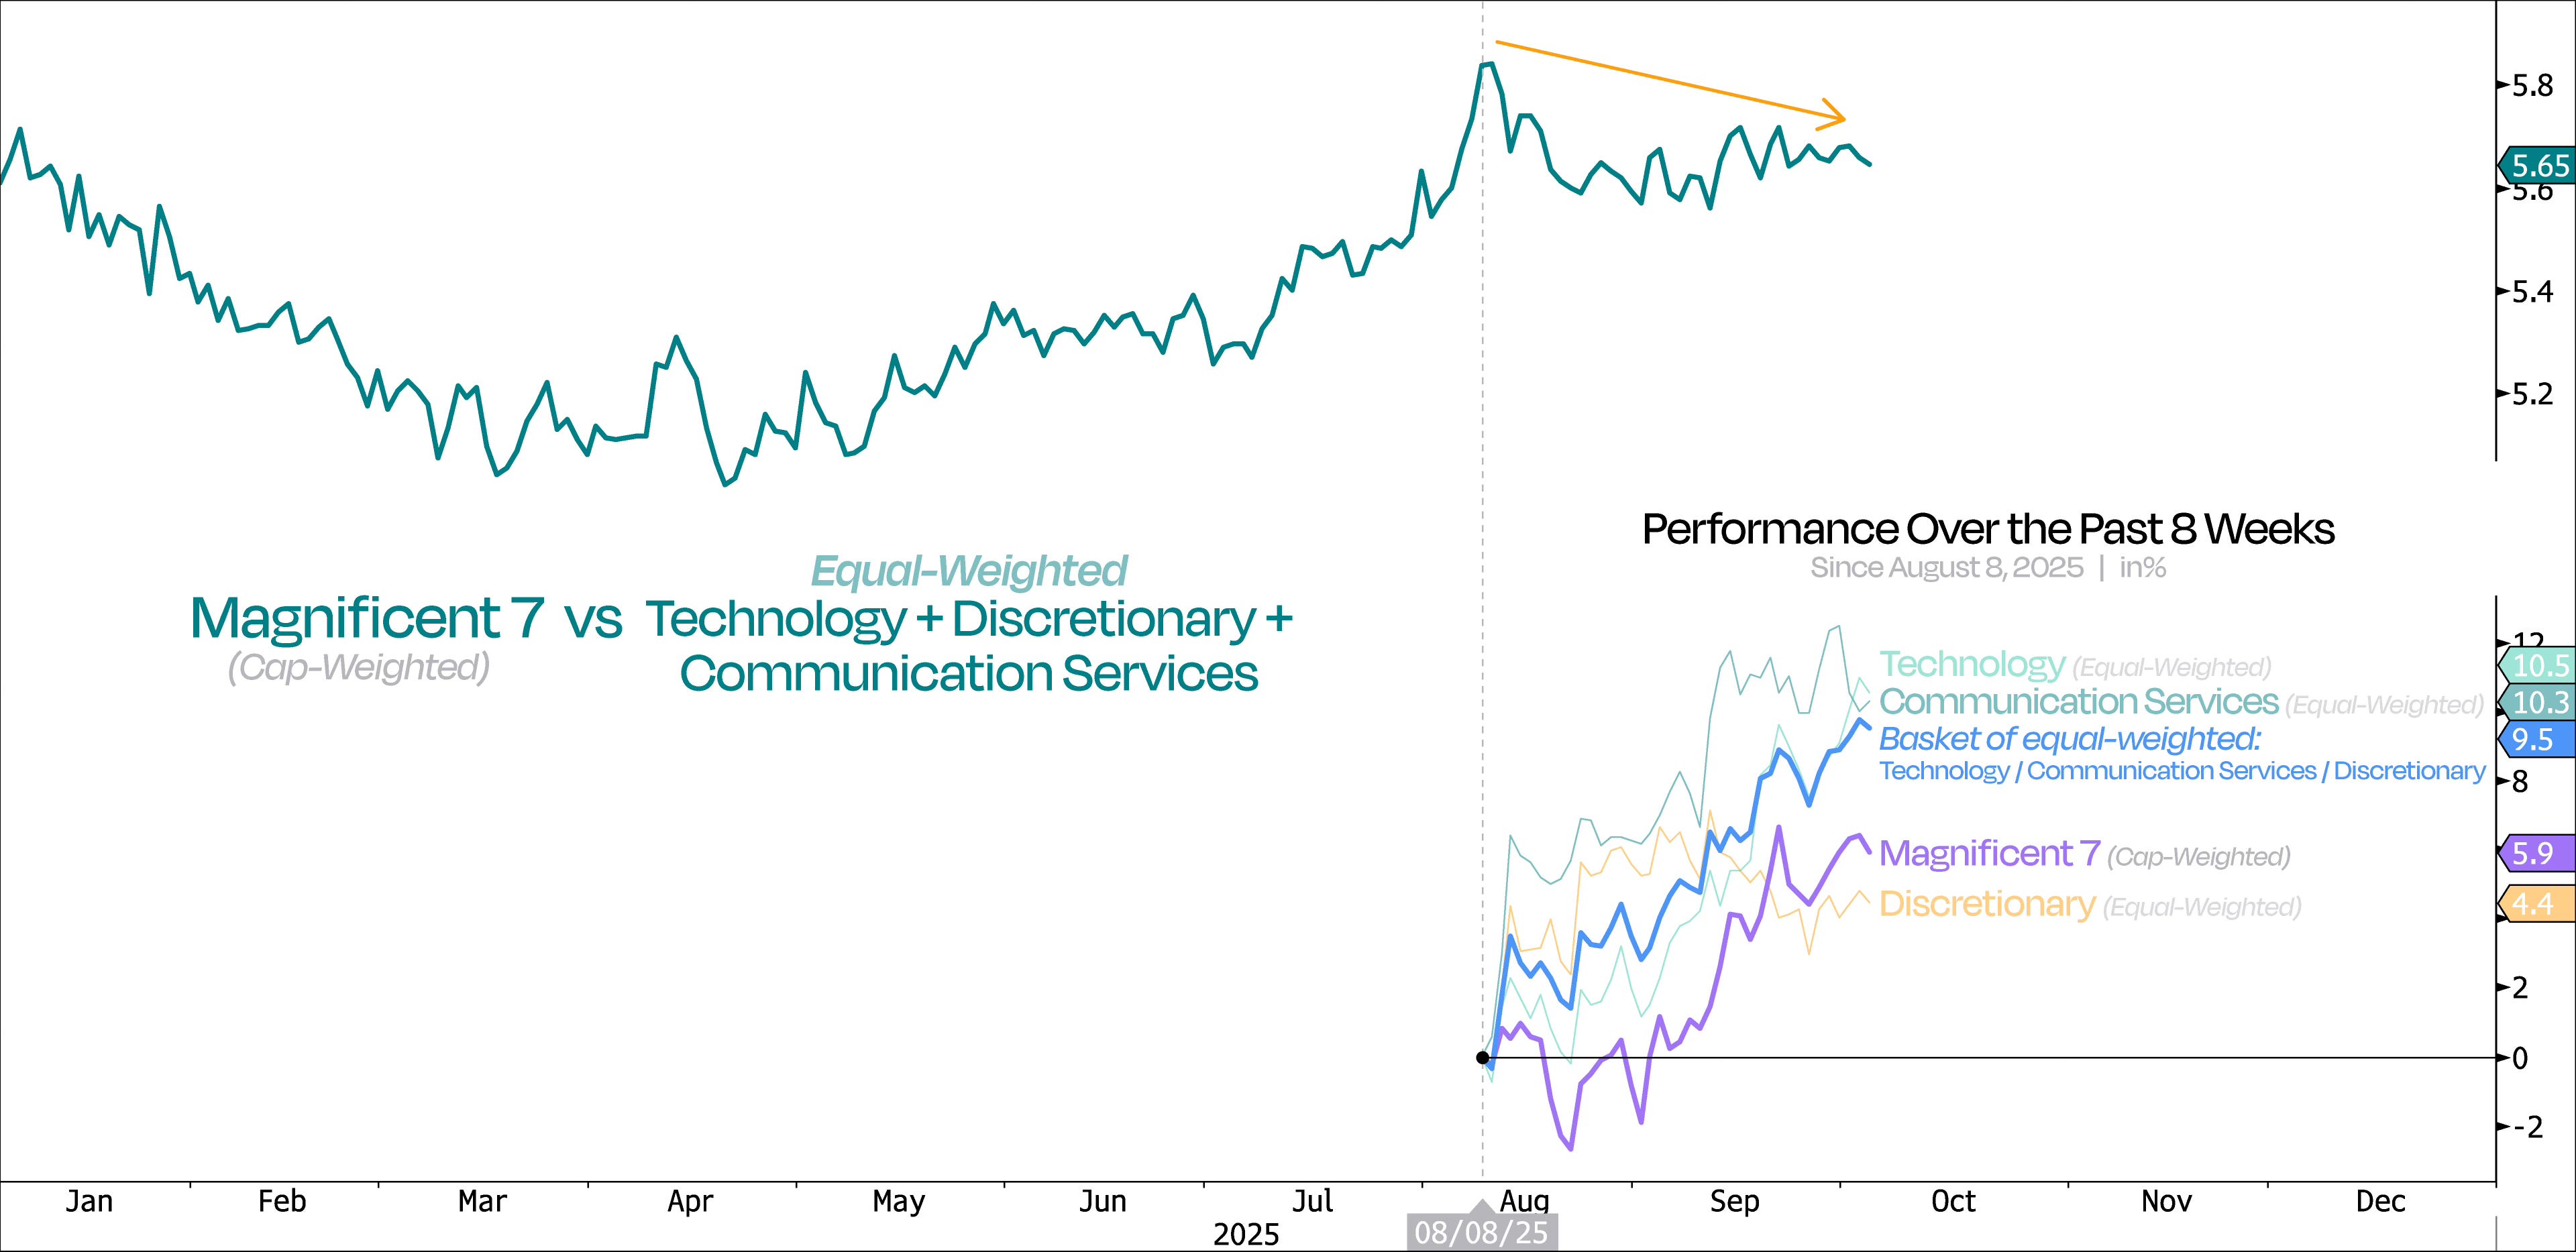
So, while Mag7 concentration signals fragility, we actually couldn’t be farther from that right now. This market remains broad, and that’s a good sign for durability.
We went back to 2020 to analyze what it usually means when the Mag7 underperform the very sectors they come from and dominate. Turns out, it can signal two completely opposite things:
Keep reading with a 7-day free trial
Subscribe to Duality Research to keep reading this post and get 7 days of free access to the full post archives.