Hey there!
We hope your weekend’s off to an amazing start.
As always, just click on the report pictures to have a closer look. 🔍
And don’t forget to follow us on X!
Enjoy!
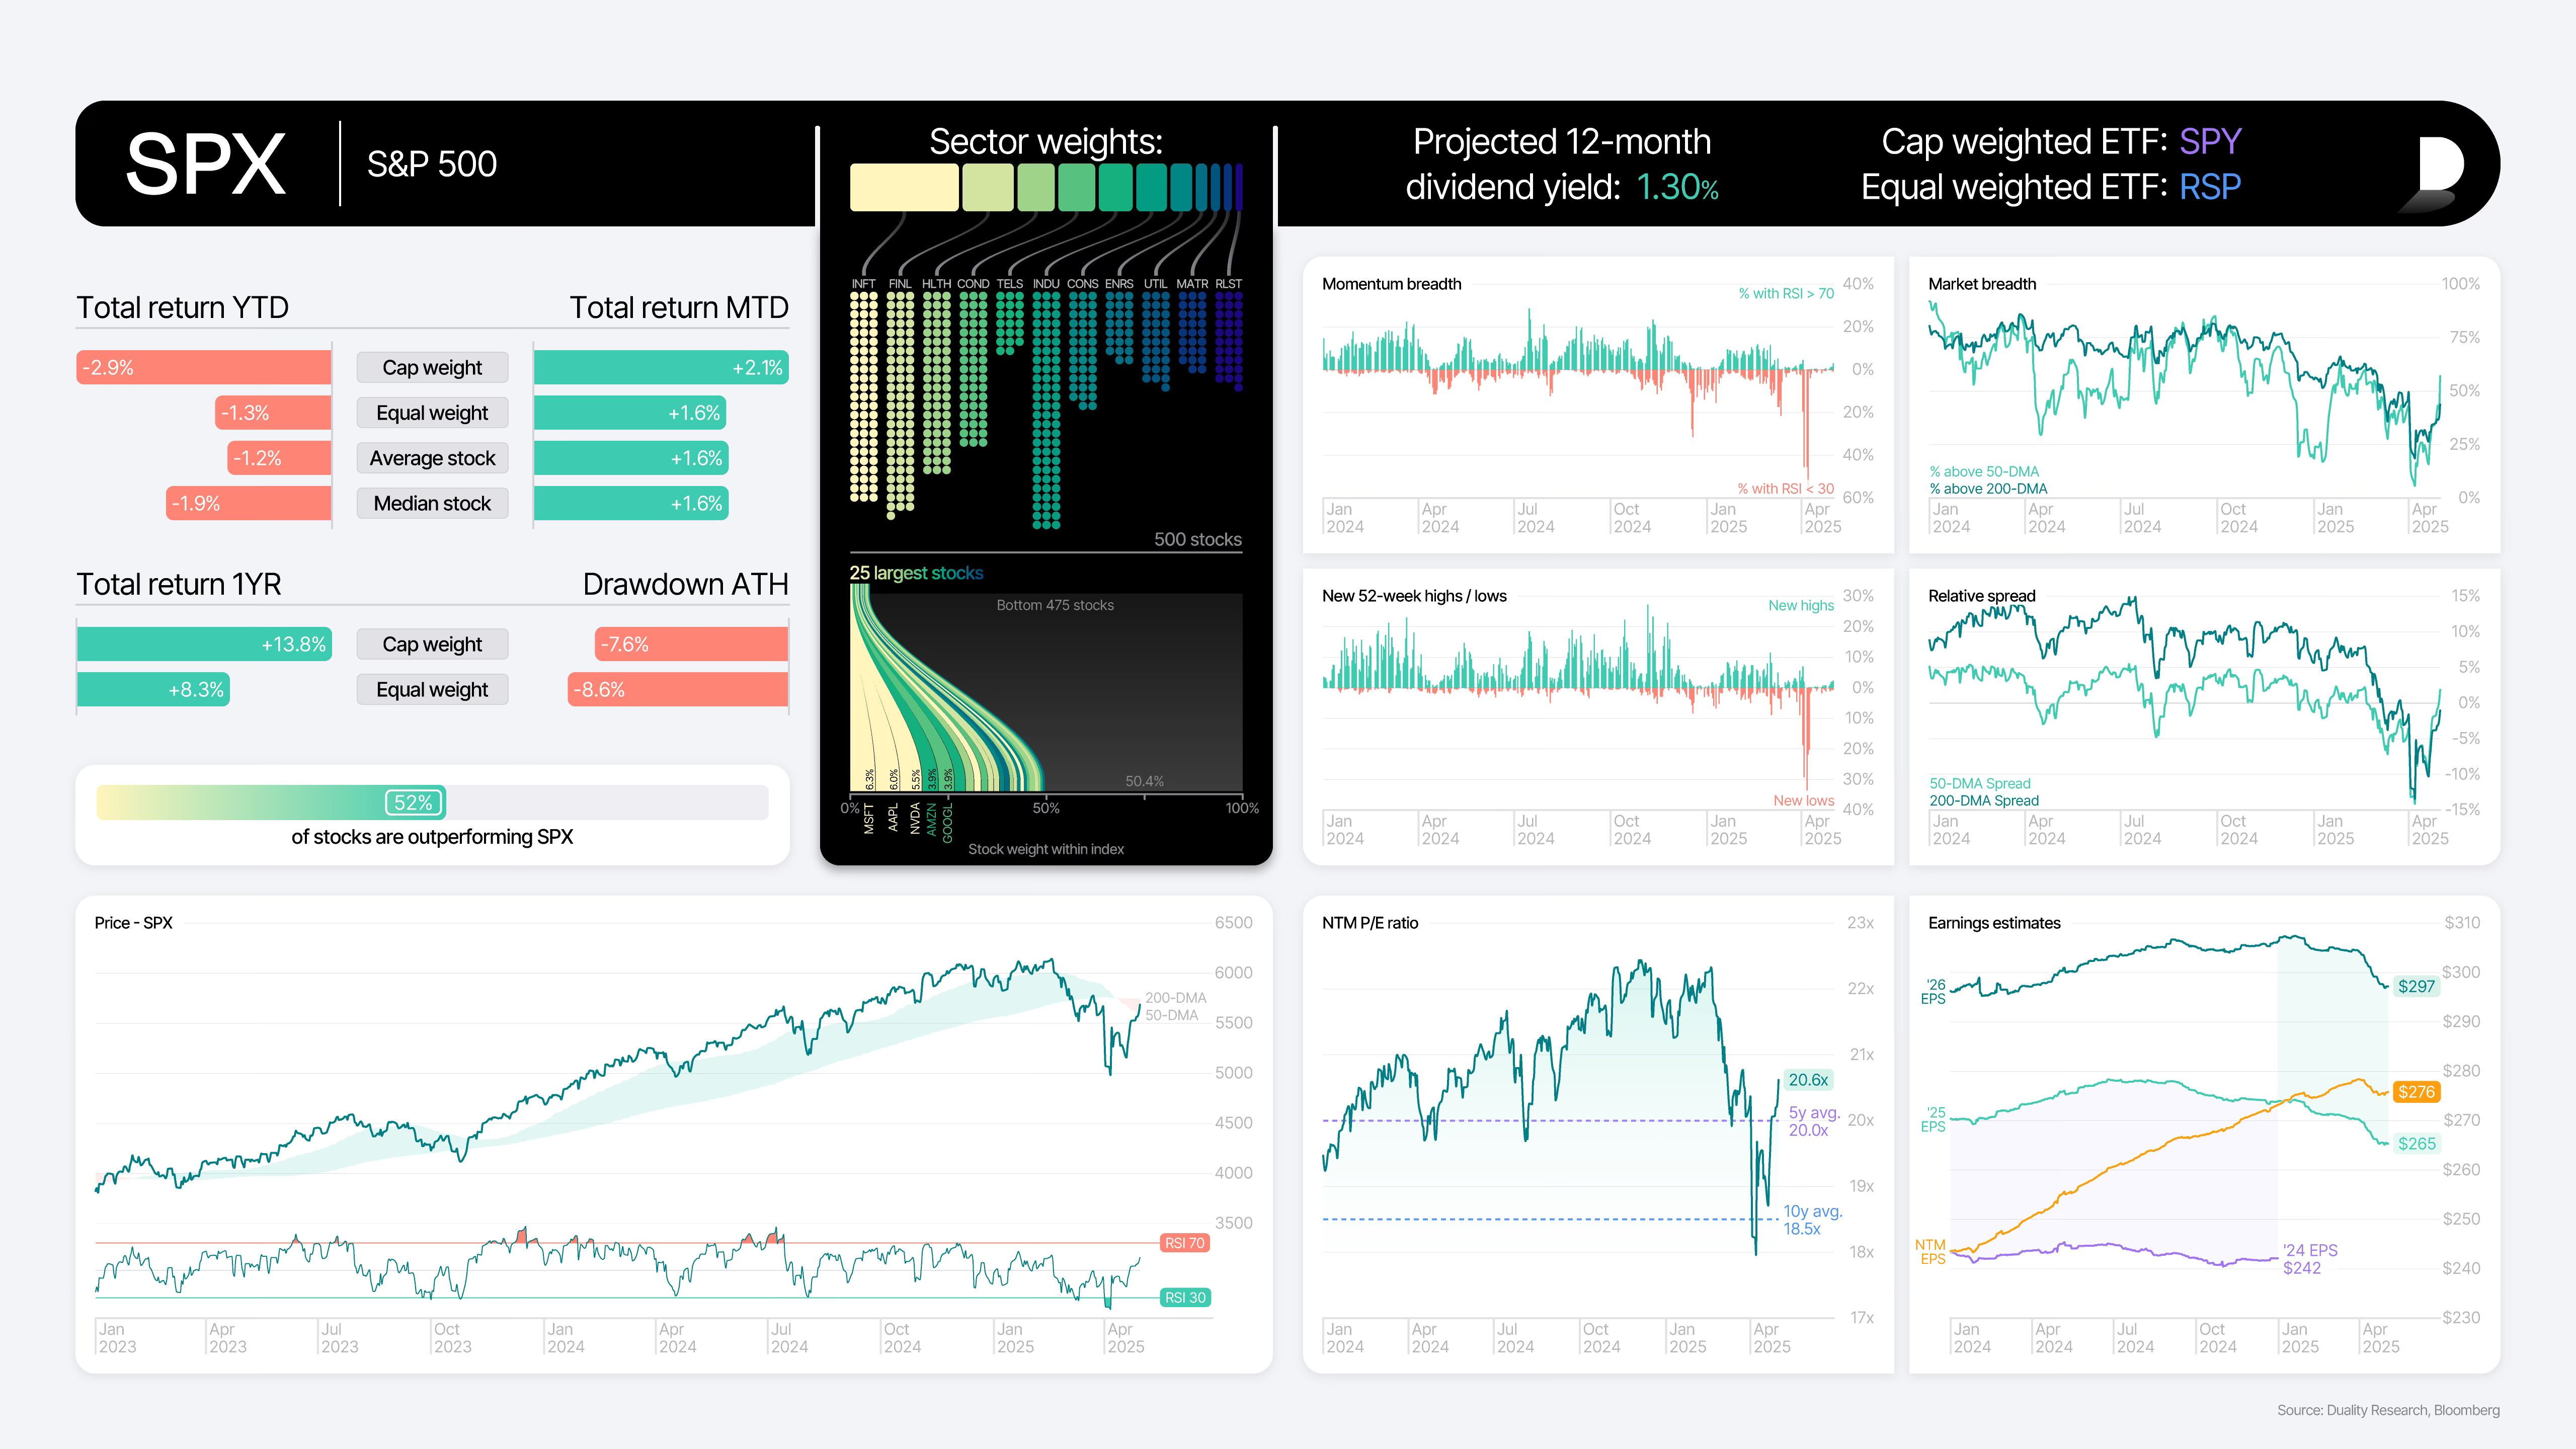
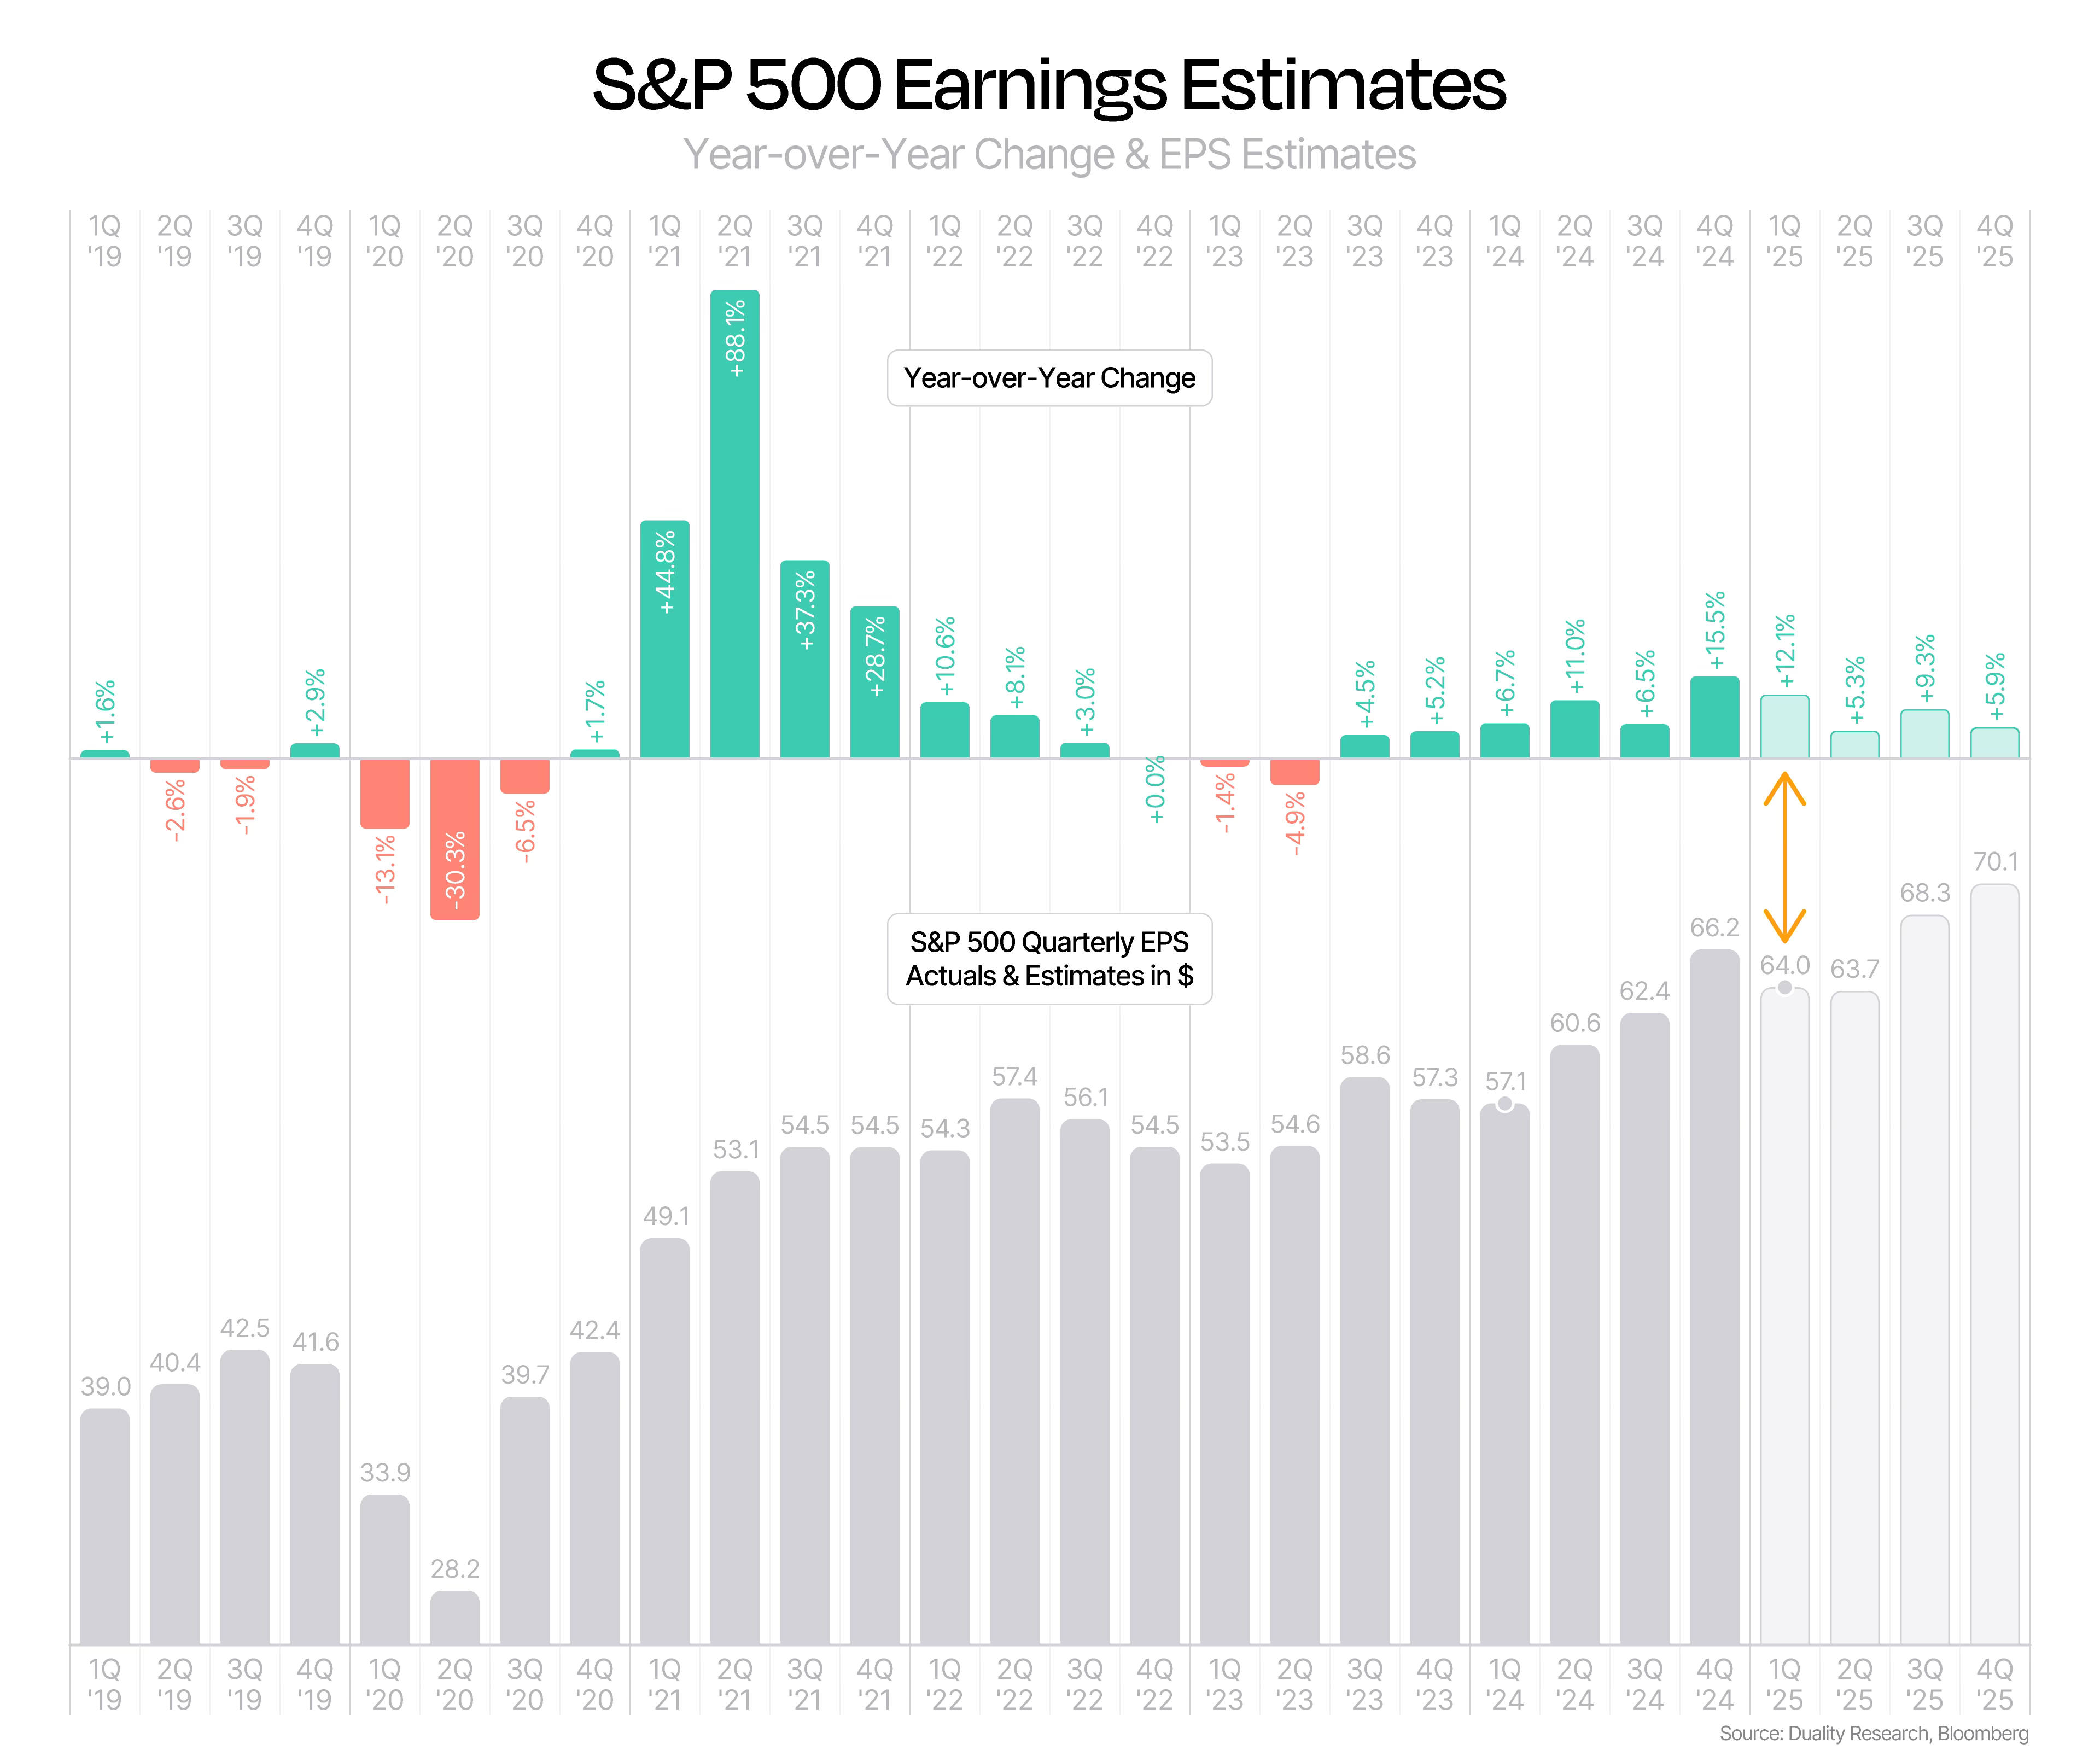
Overview of the S&P 500
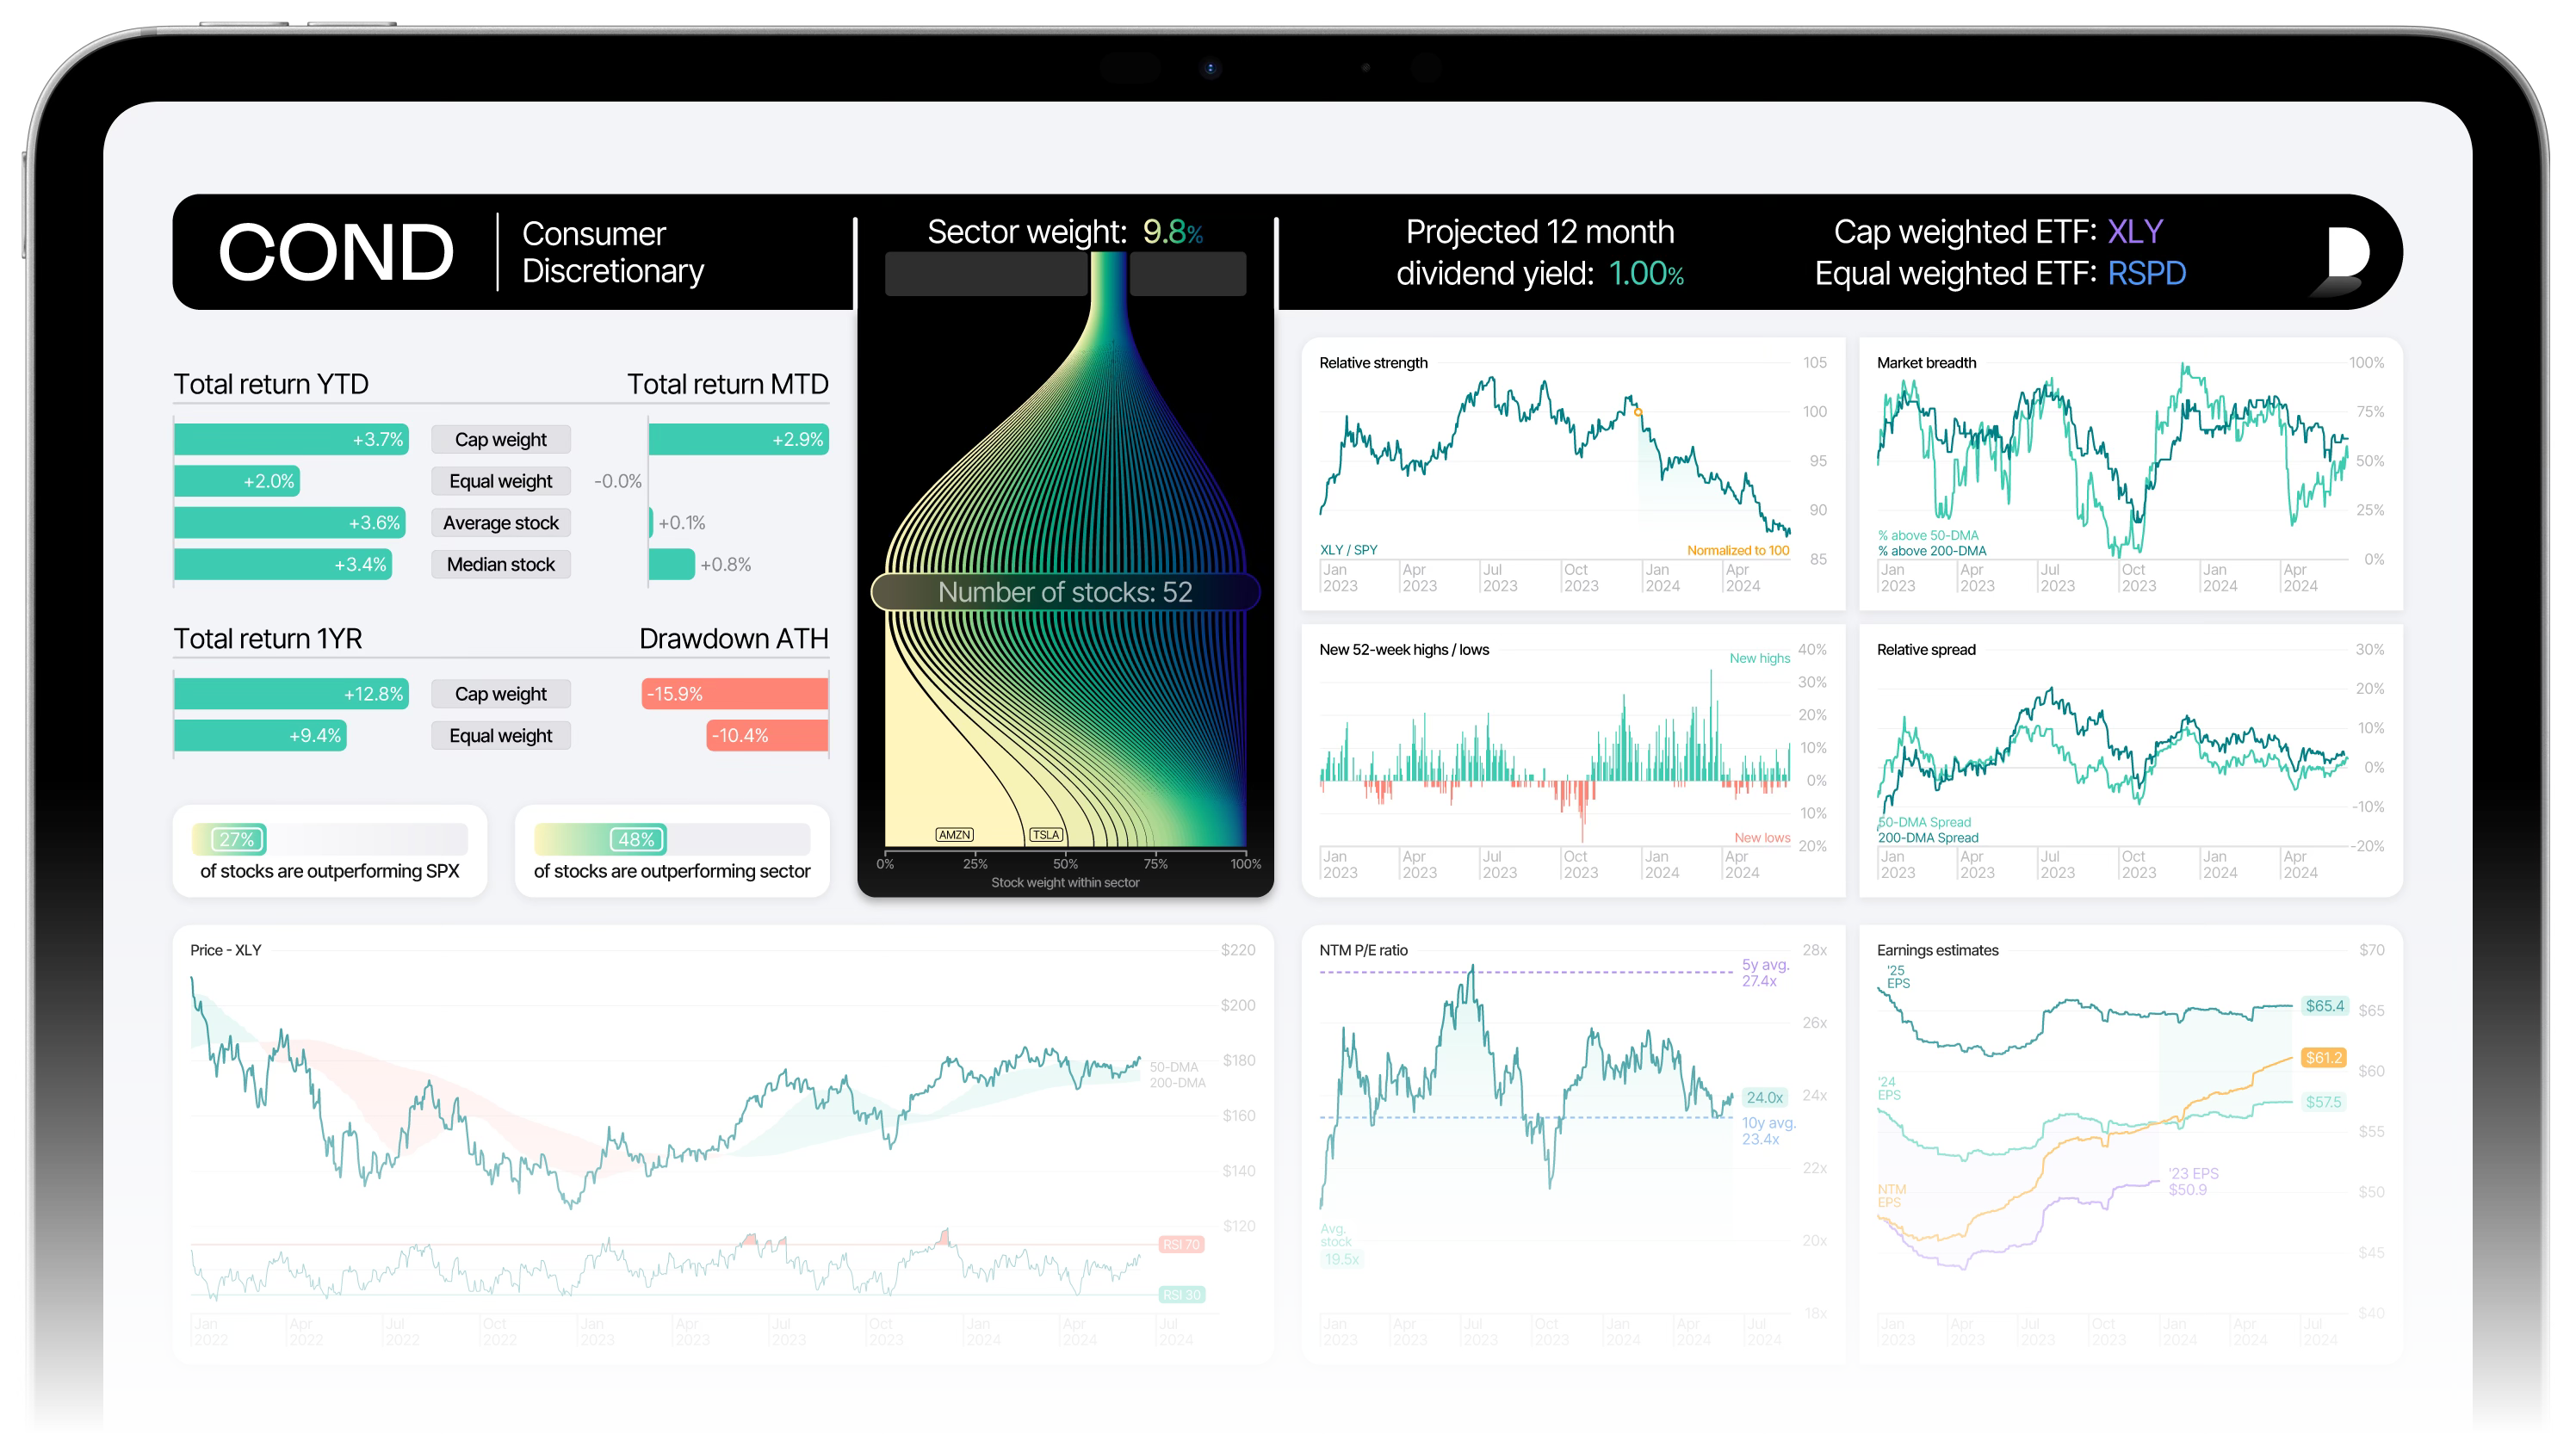
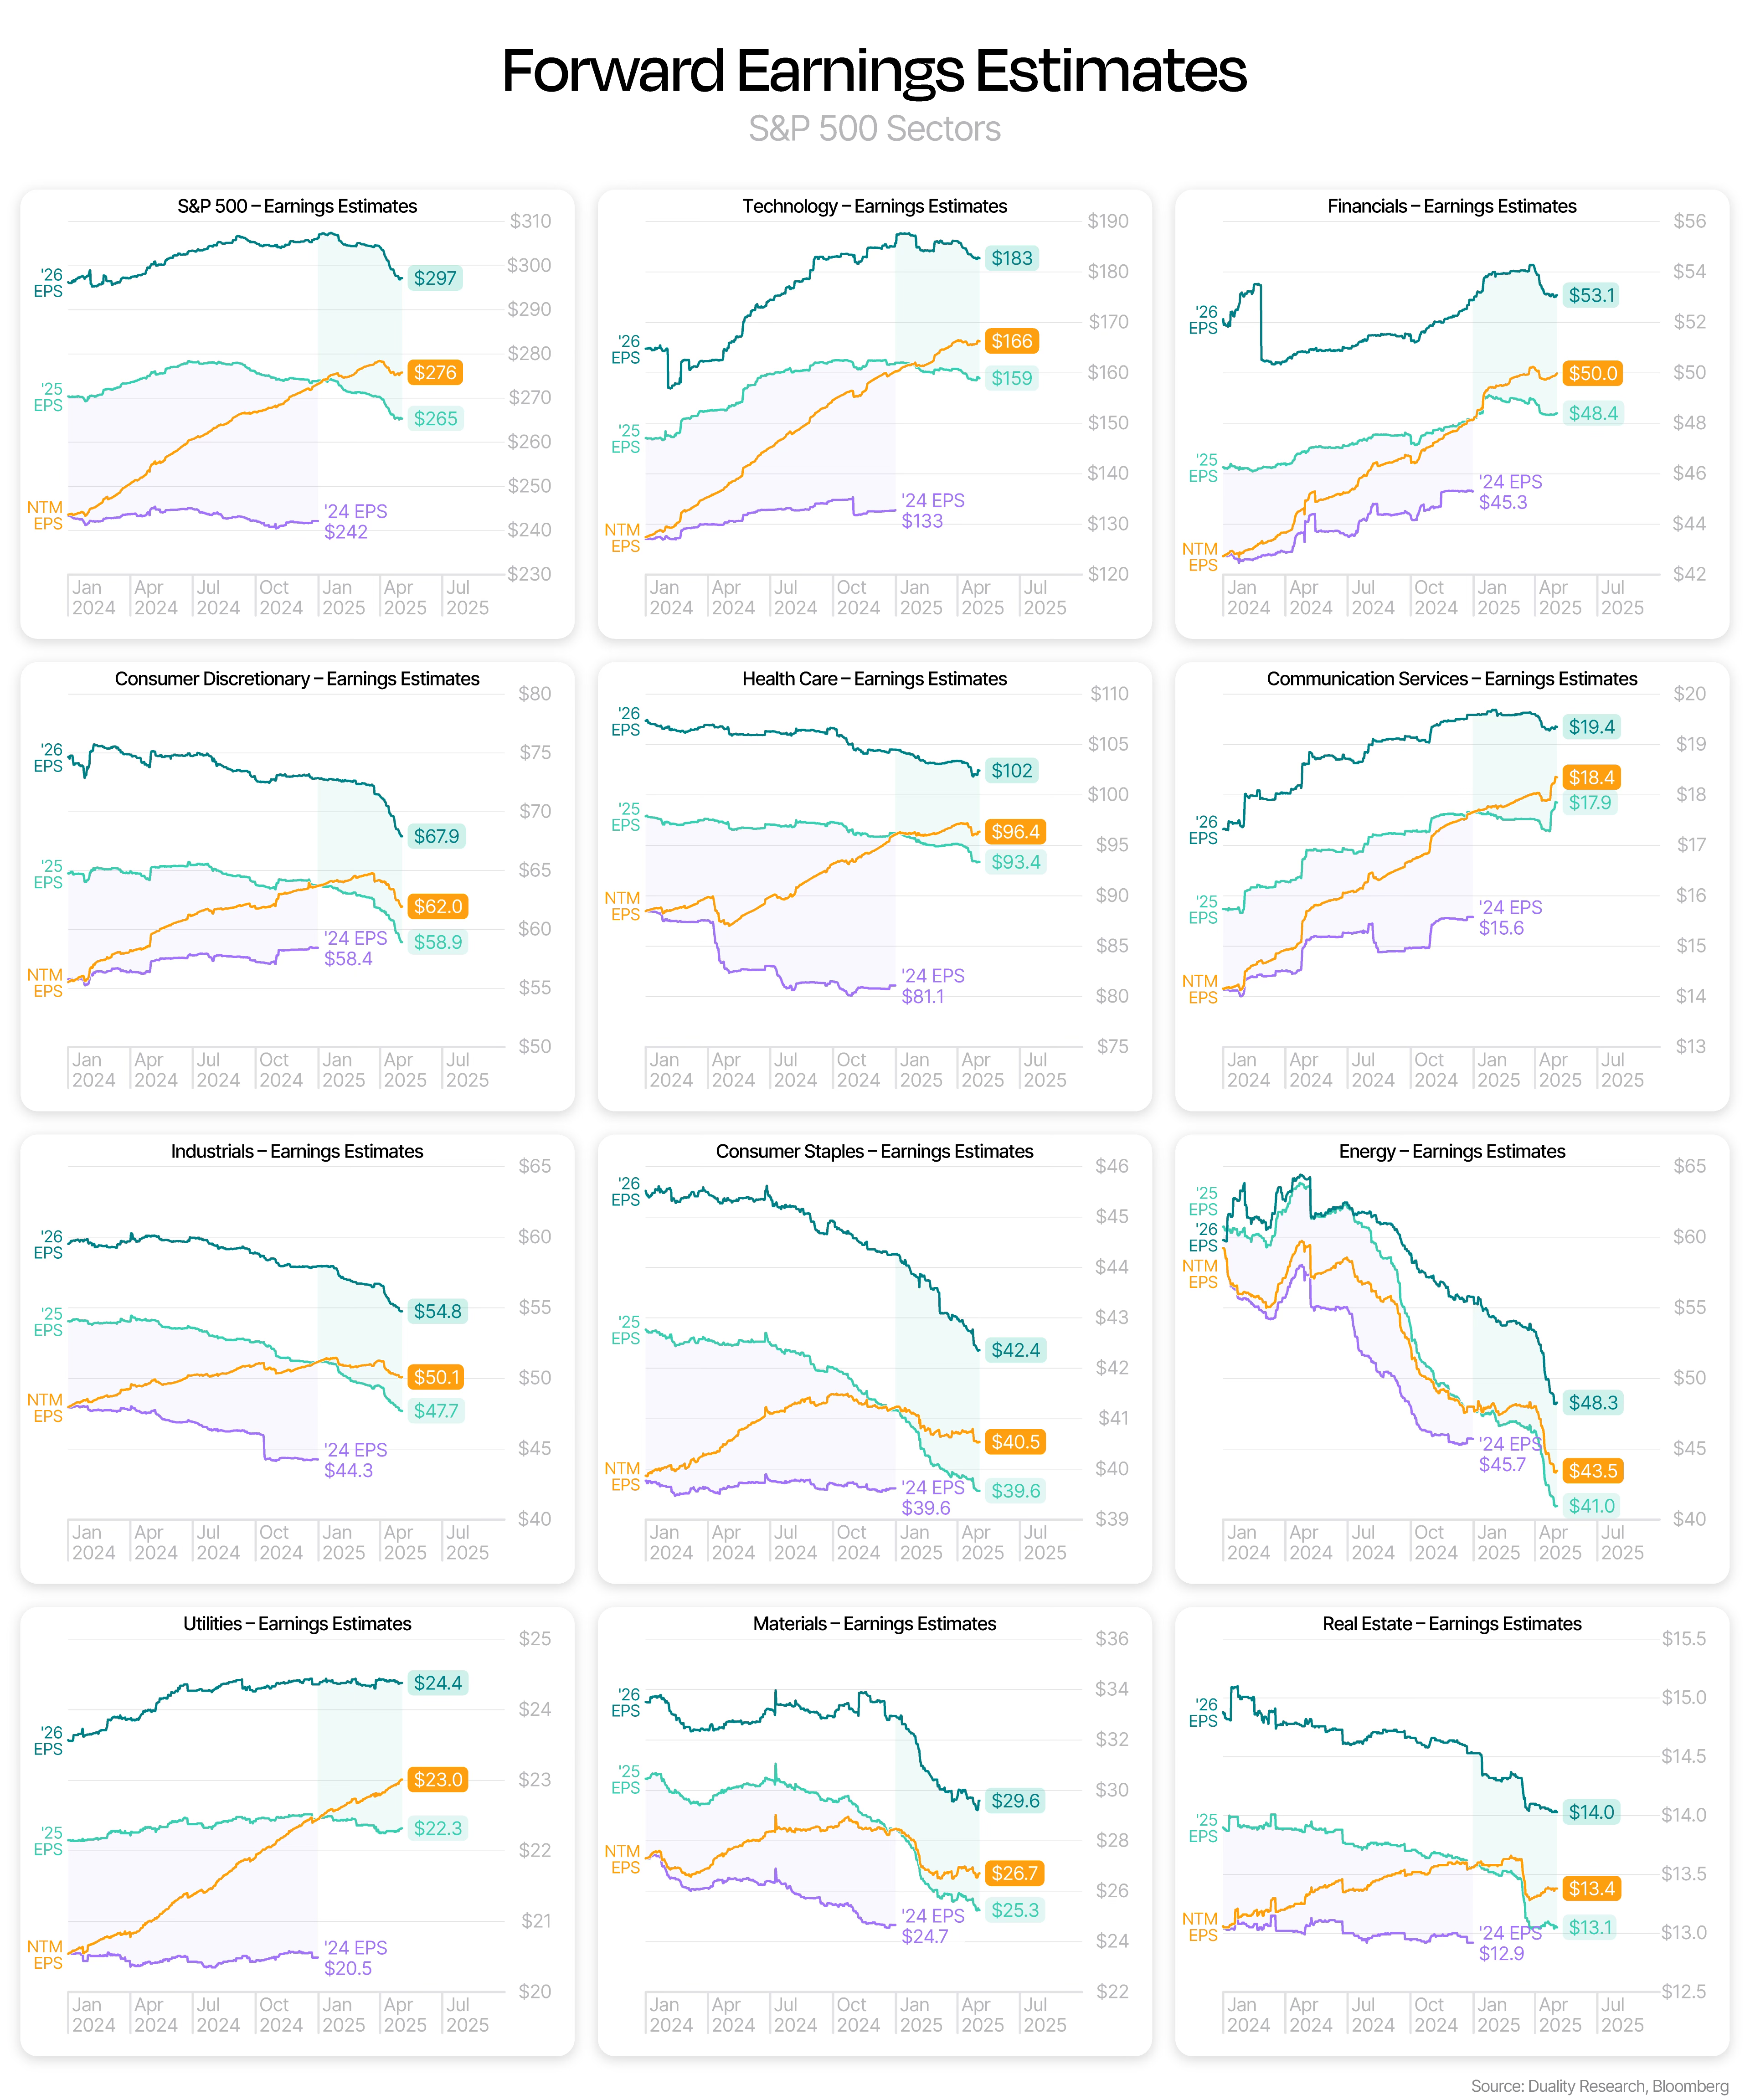
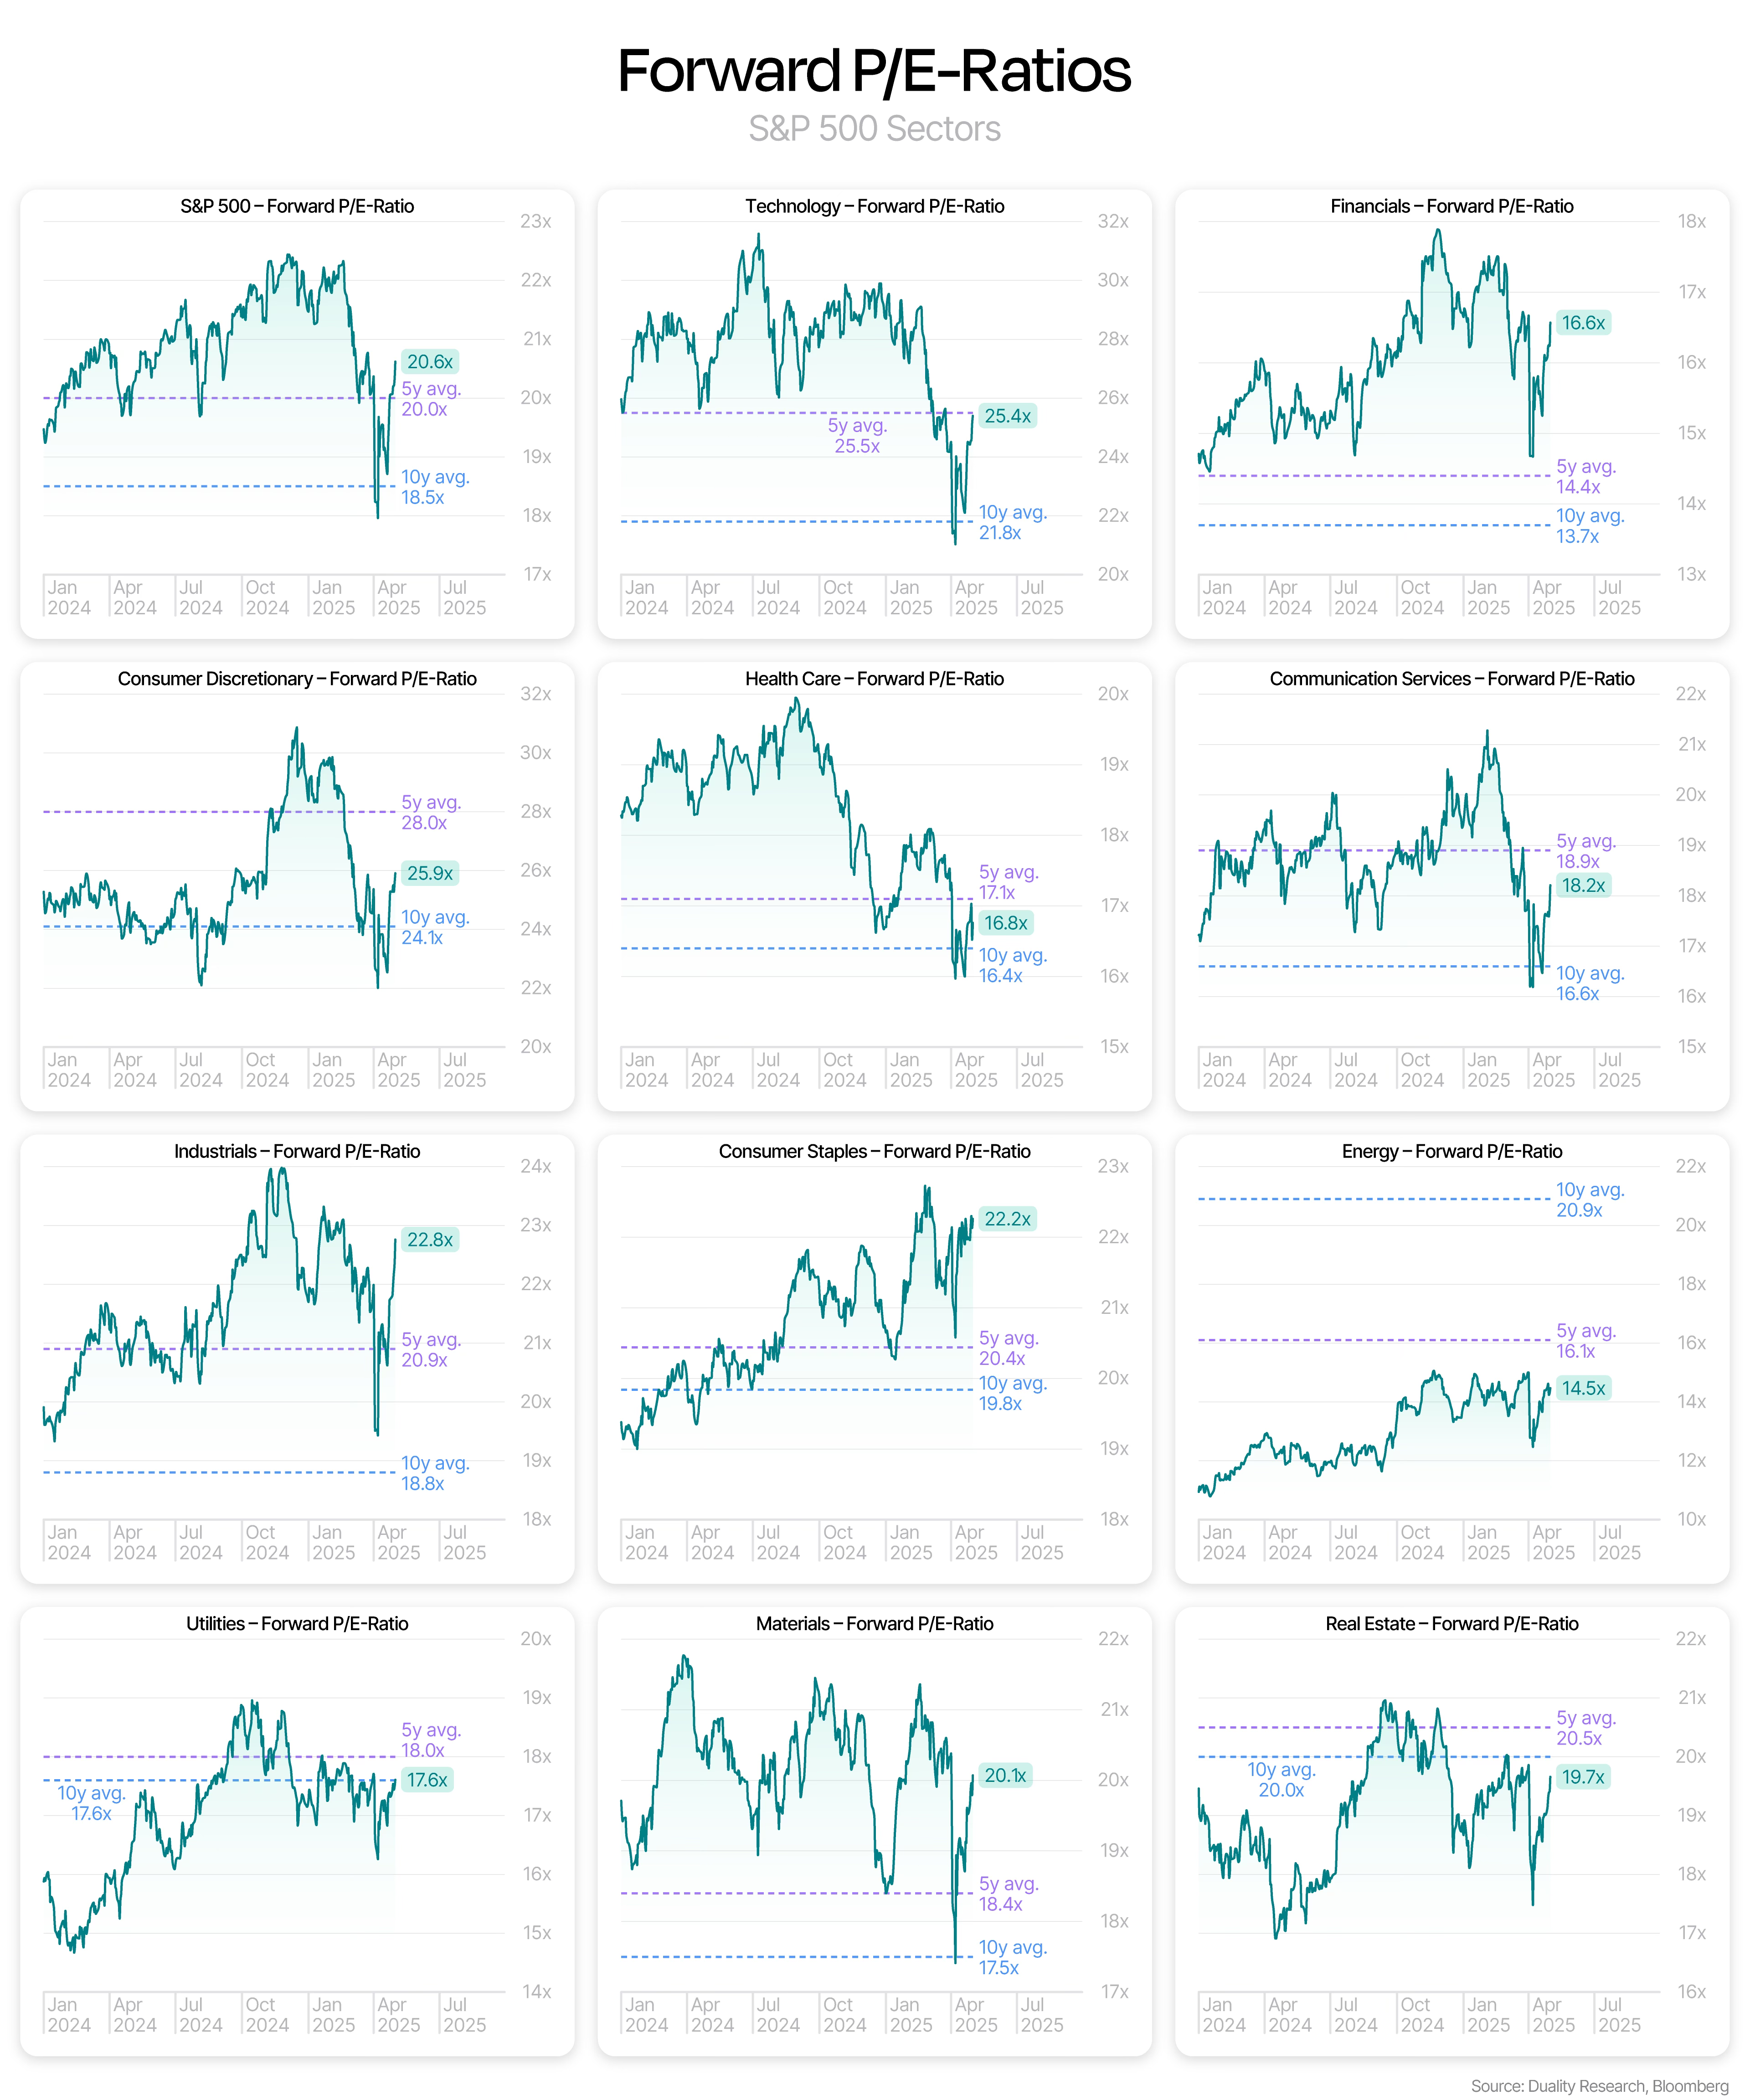
For a complete breakdown of every sector,
download our S&P 500 Sector Dashboard.
What moved this week?
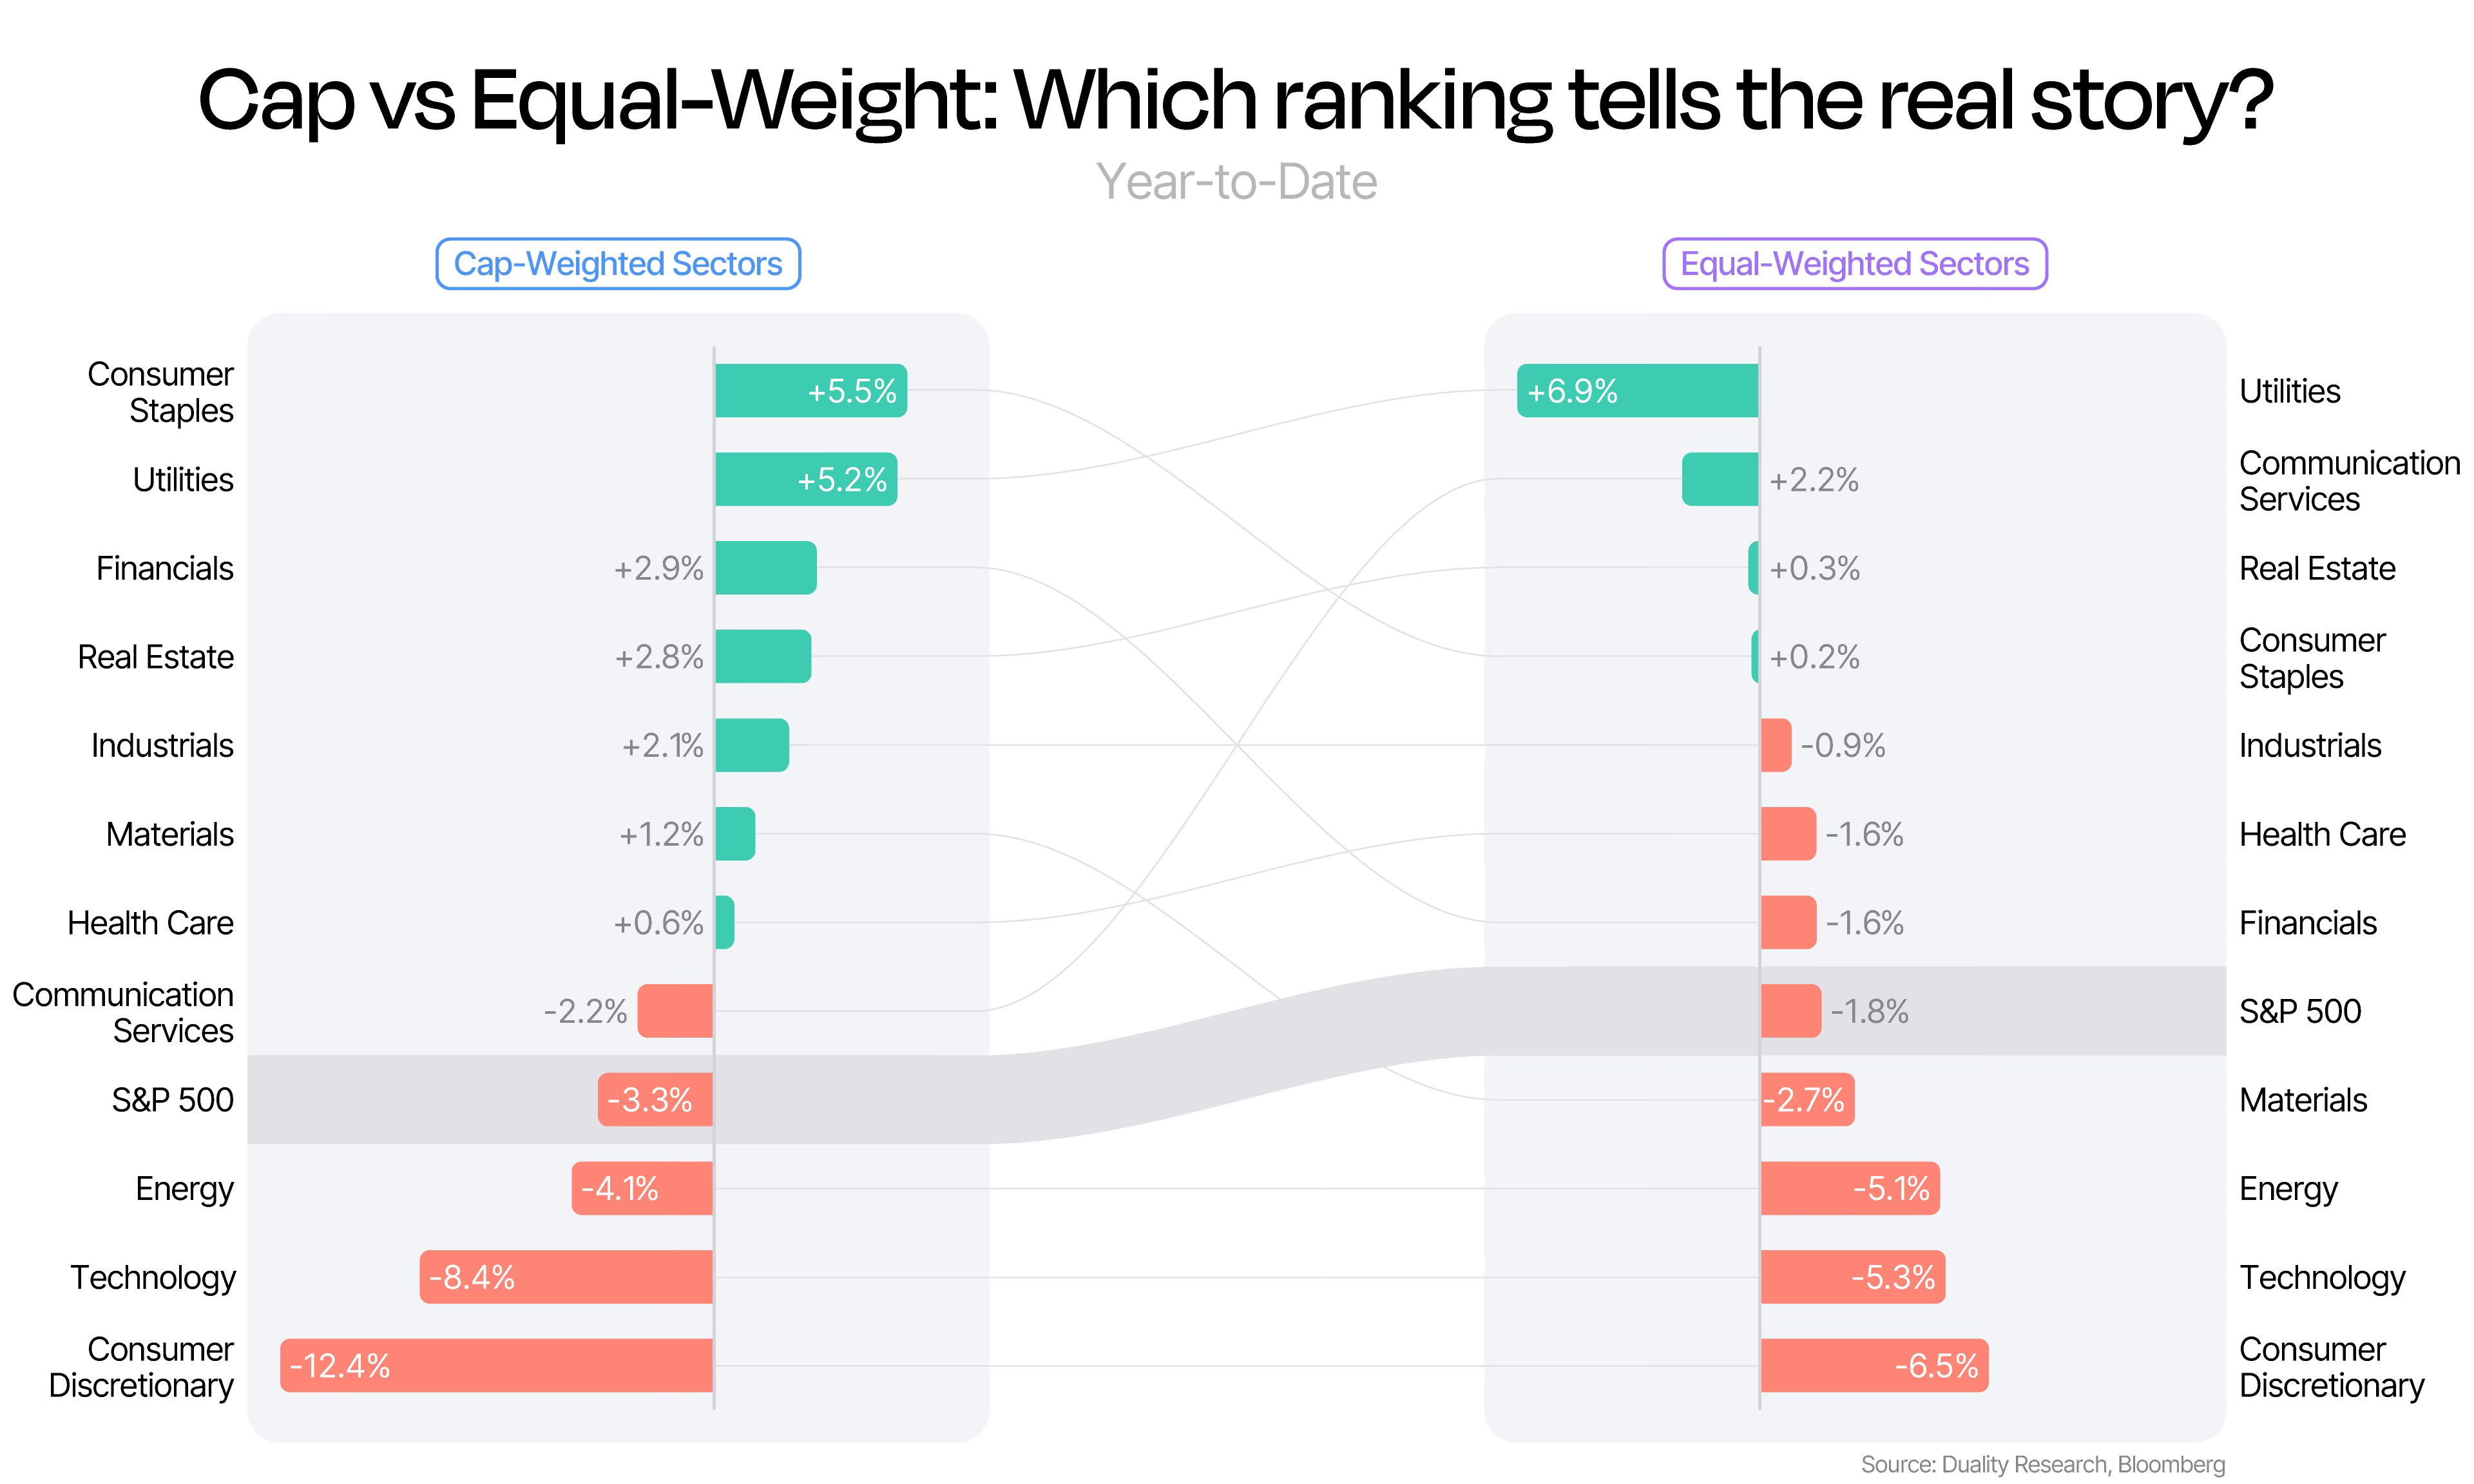
🇺🇸 The S&P 500 jumped +2.92%
⚖️ The average stock returned +2.61%
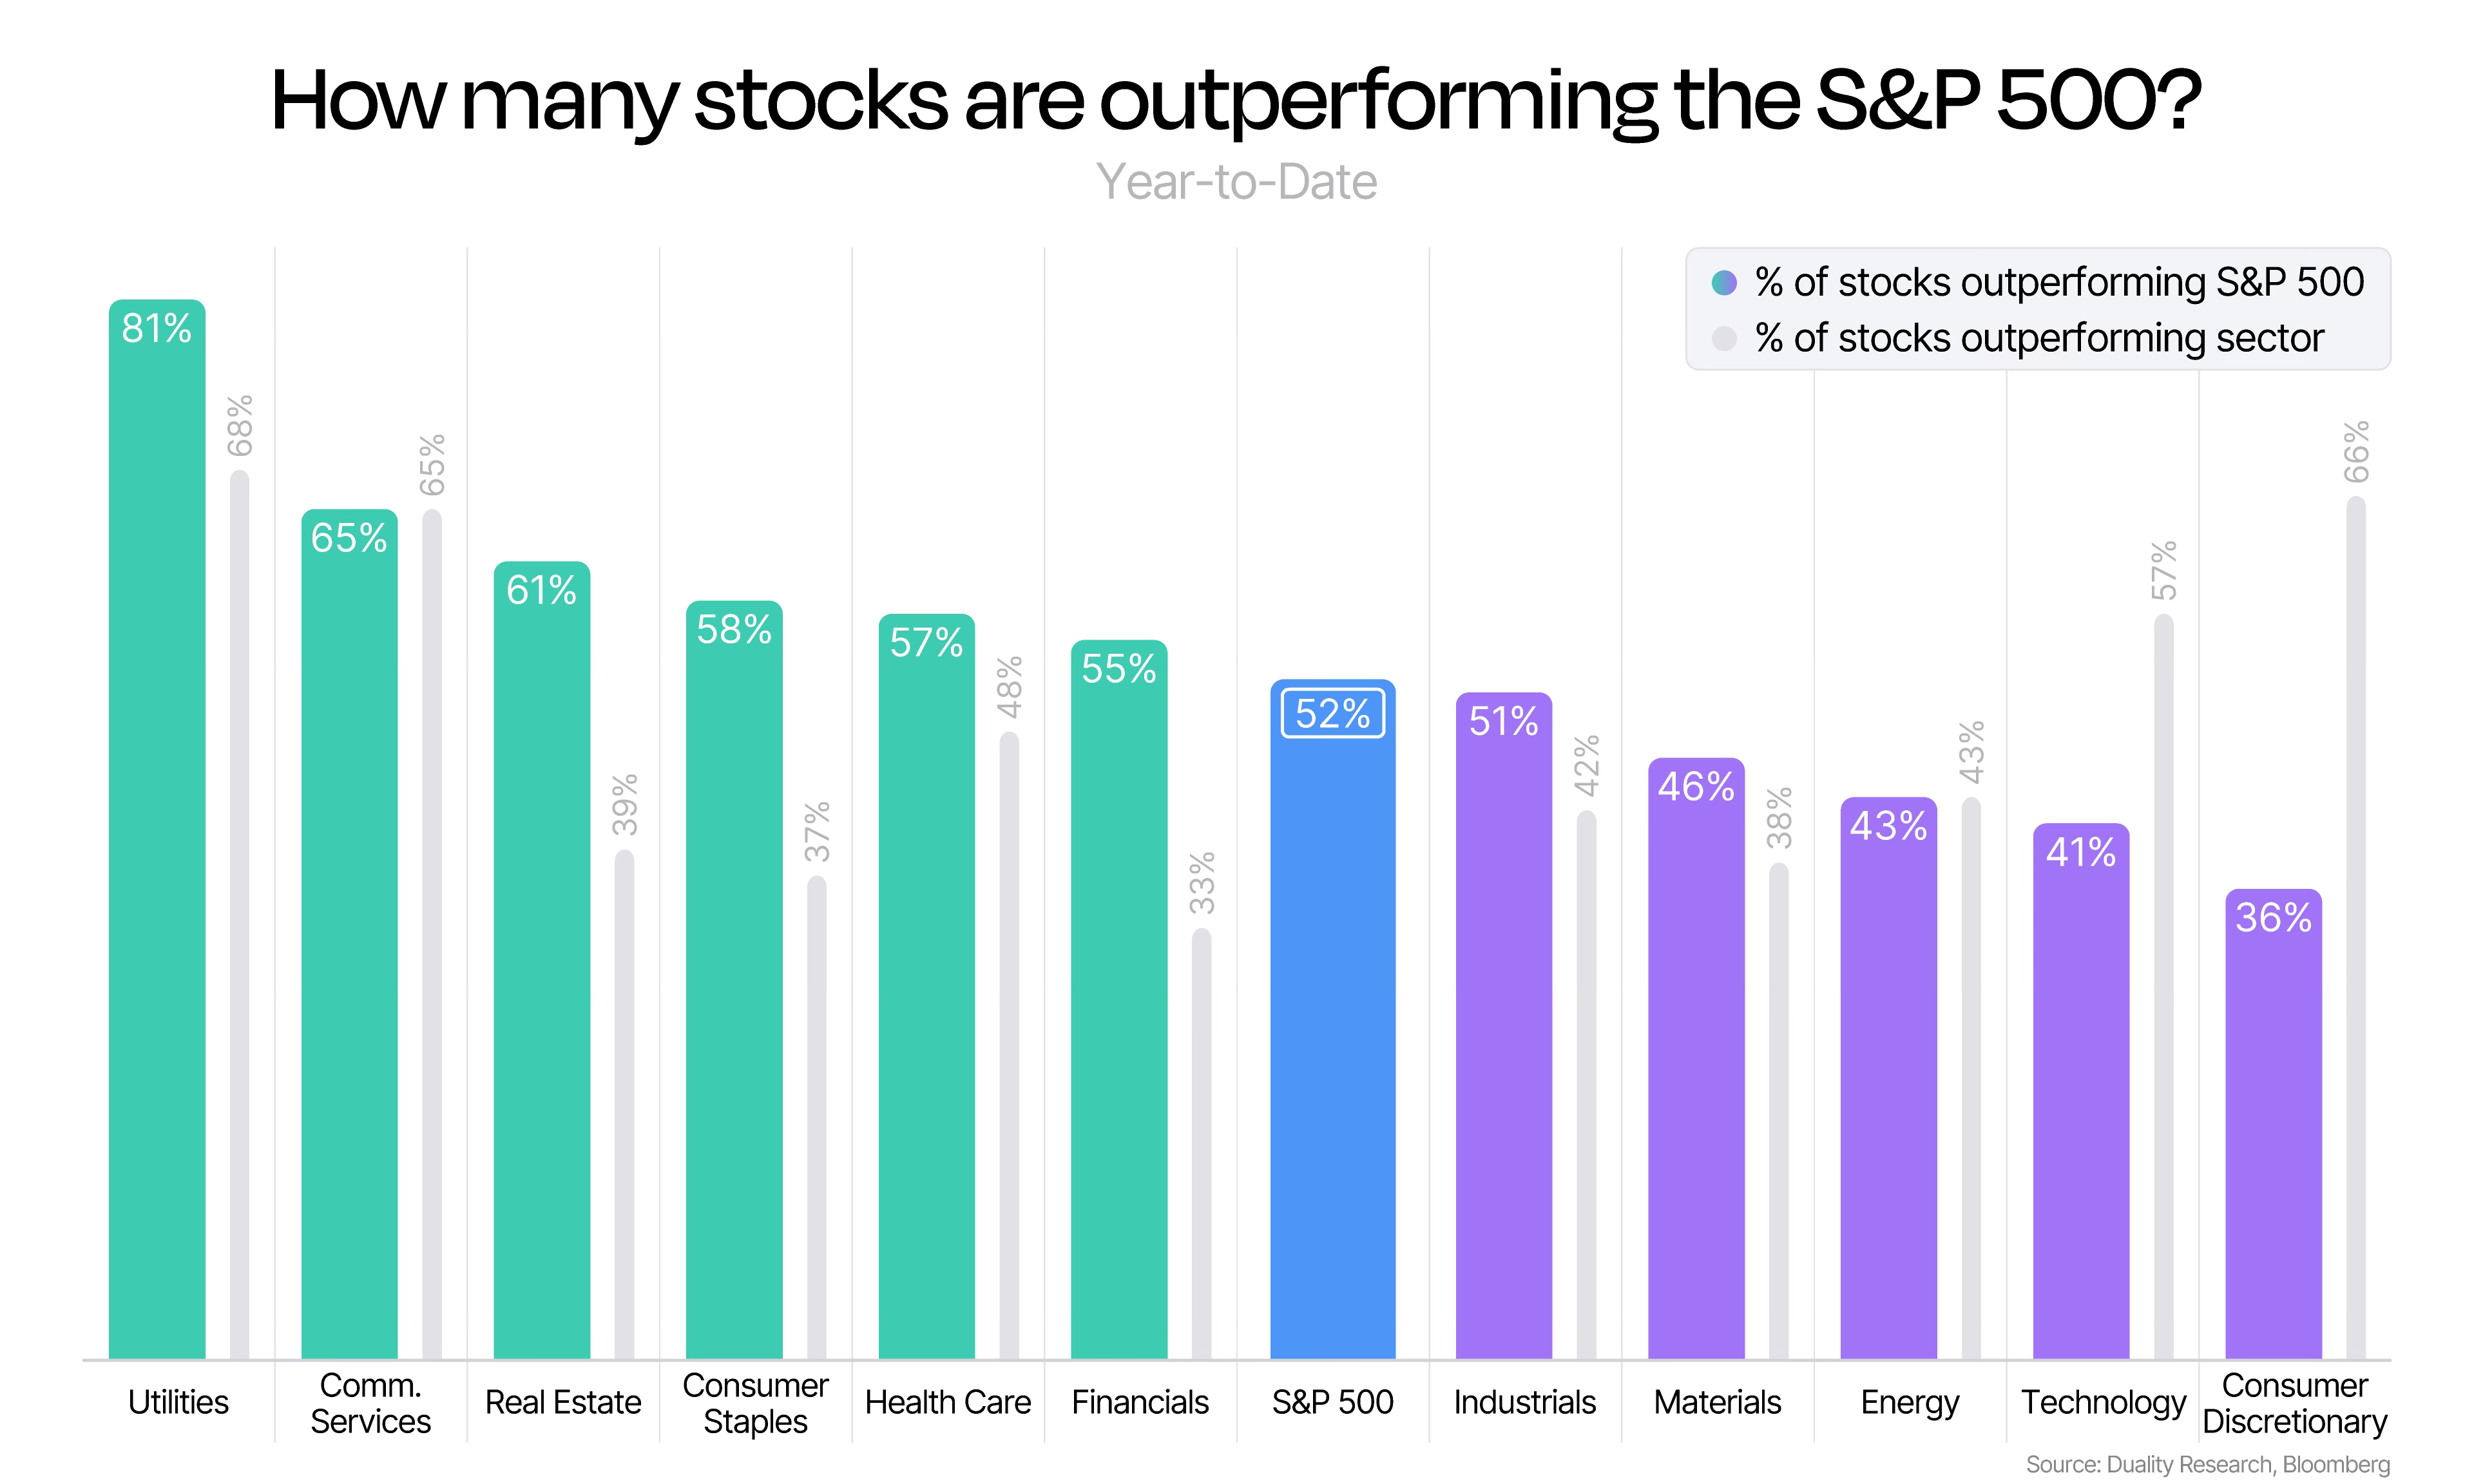
💪🏼 232 stocks outperformed the index
📈 Best sector: Industrials +4.3%
📉 Worst sector: Energy -0.6%
📈 Best stock: CARR +19.1%
📉 Worst stock: BDX -17.7%

Click here to see what moved in April!
Sector Metrics in Focus
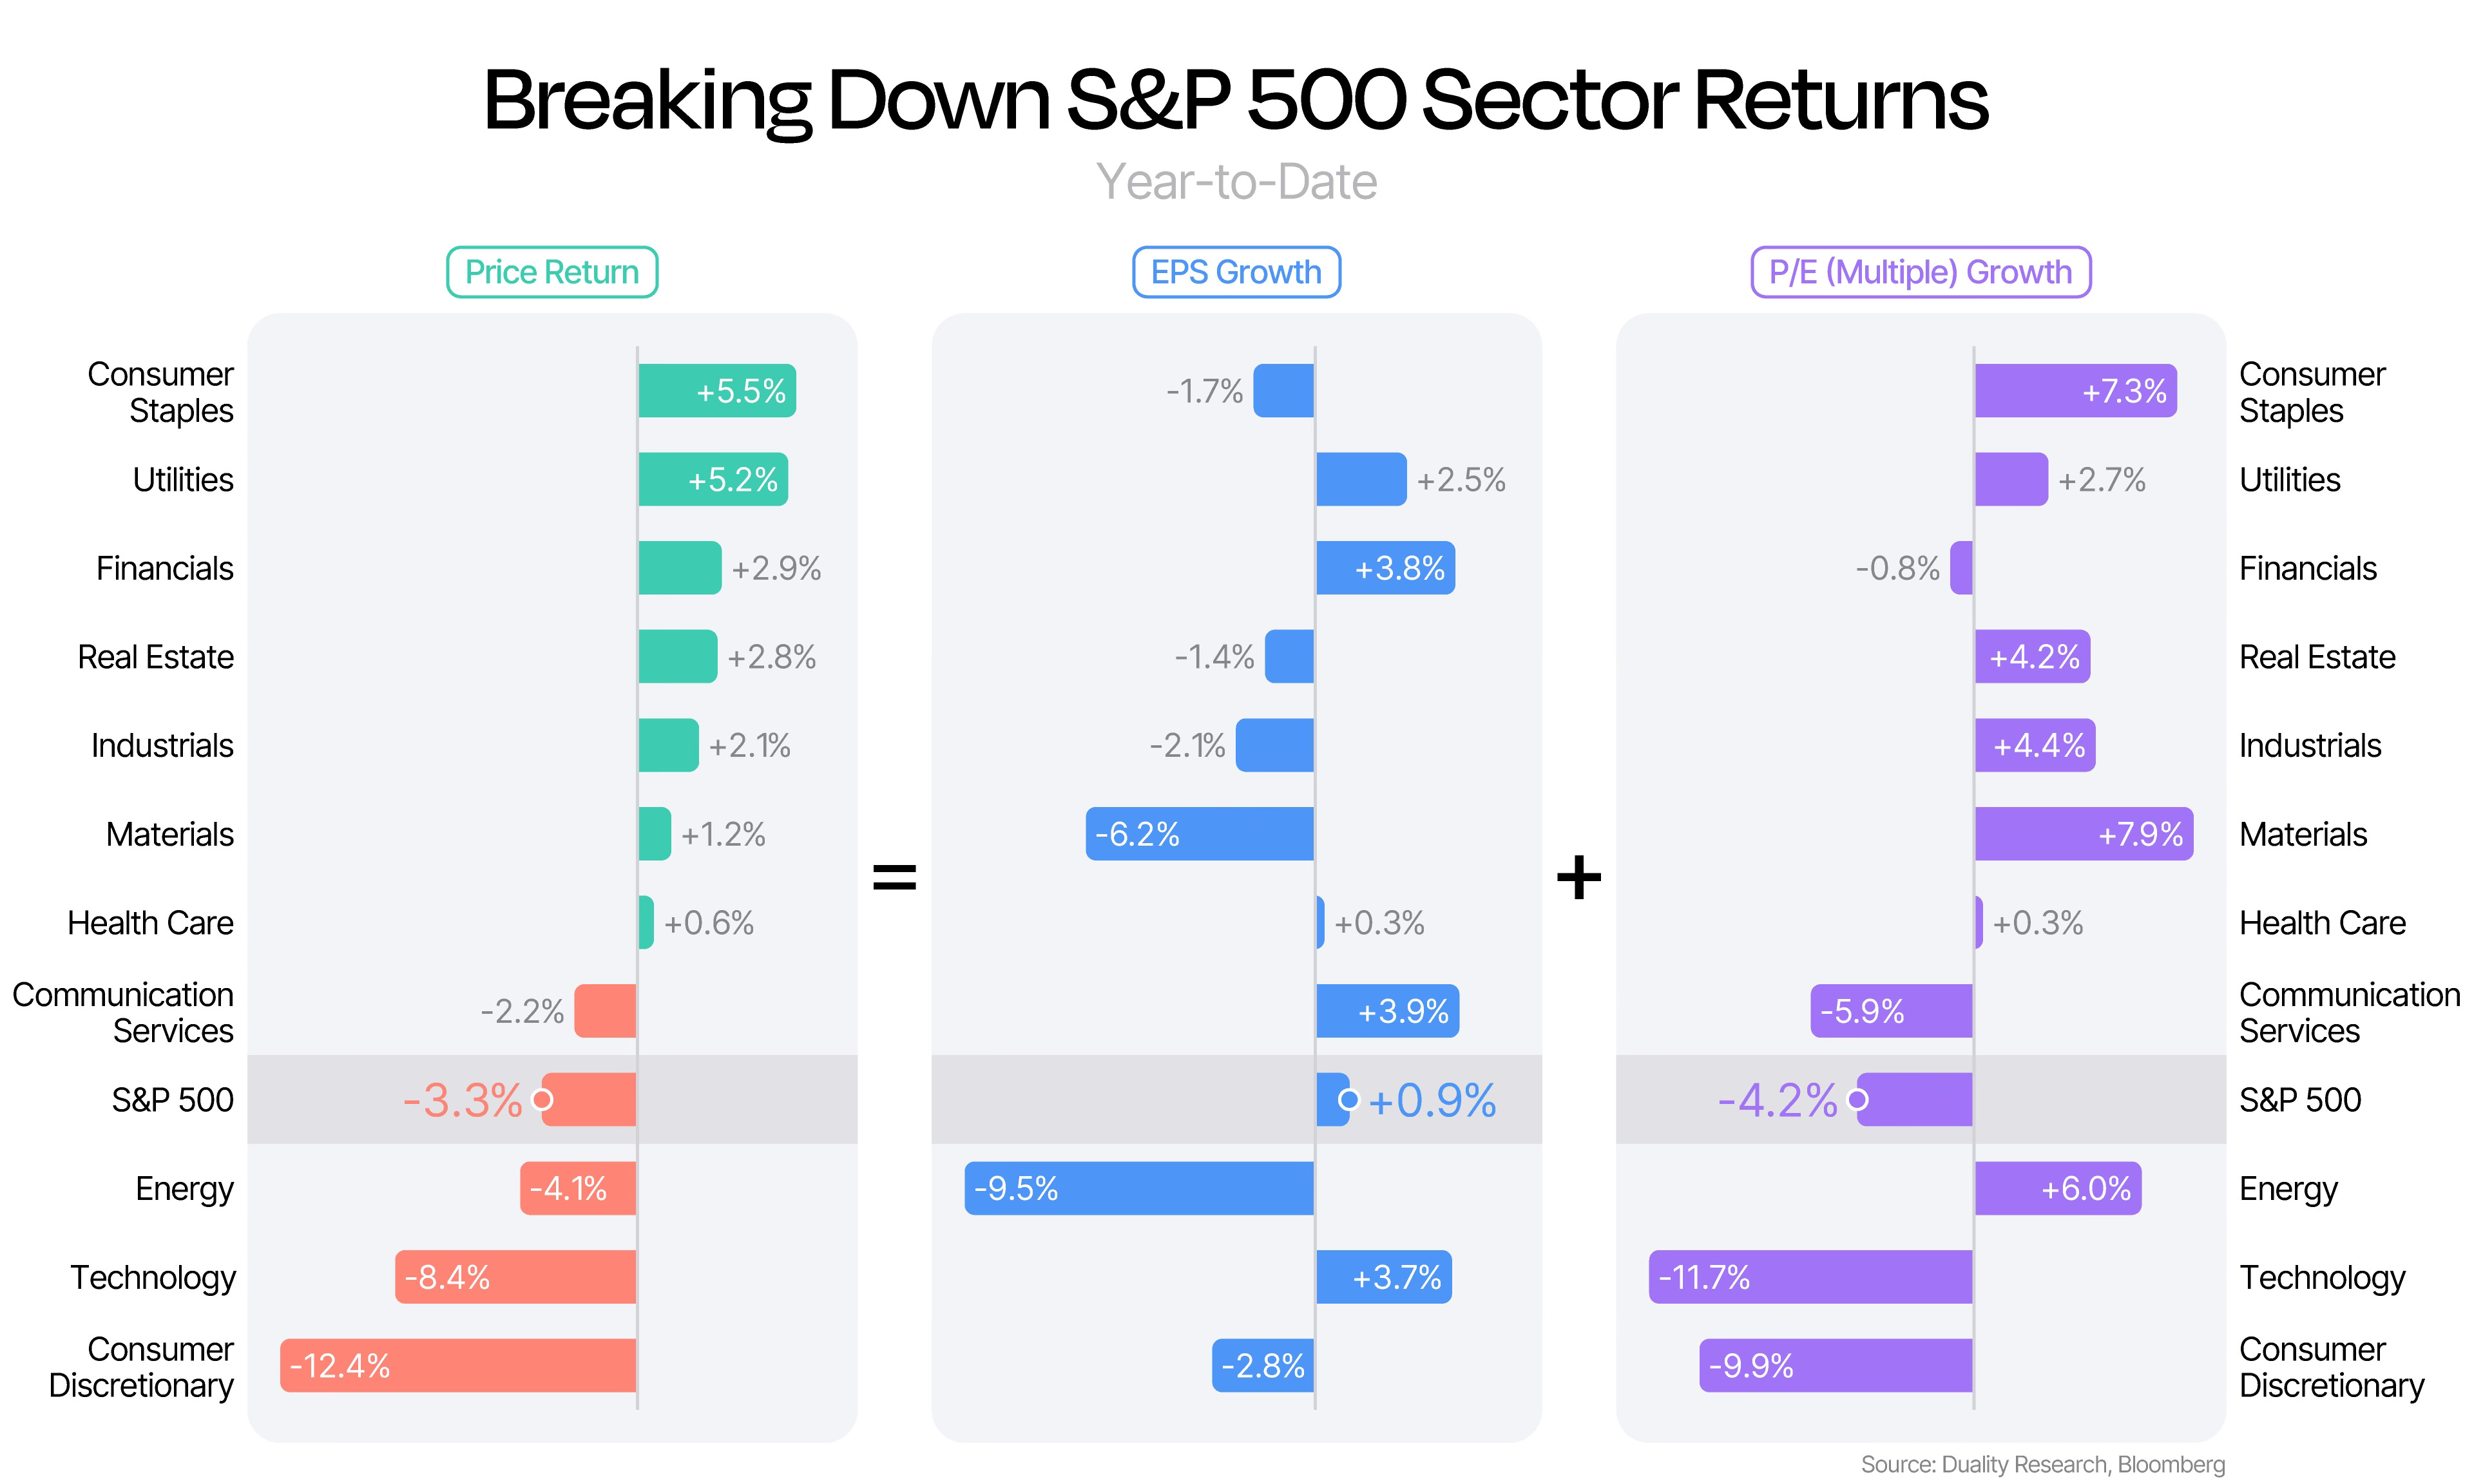
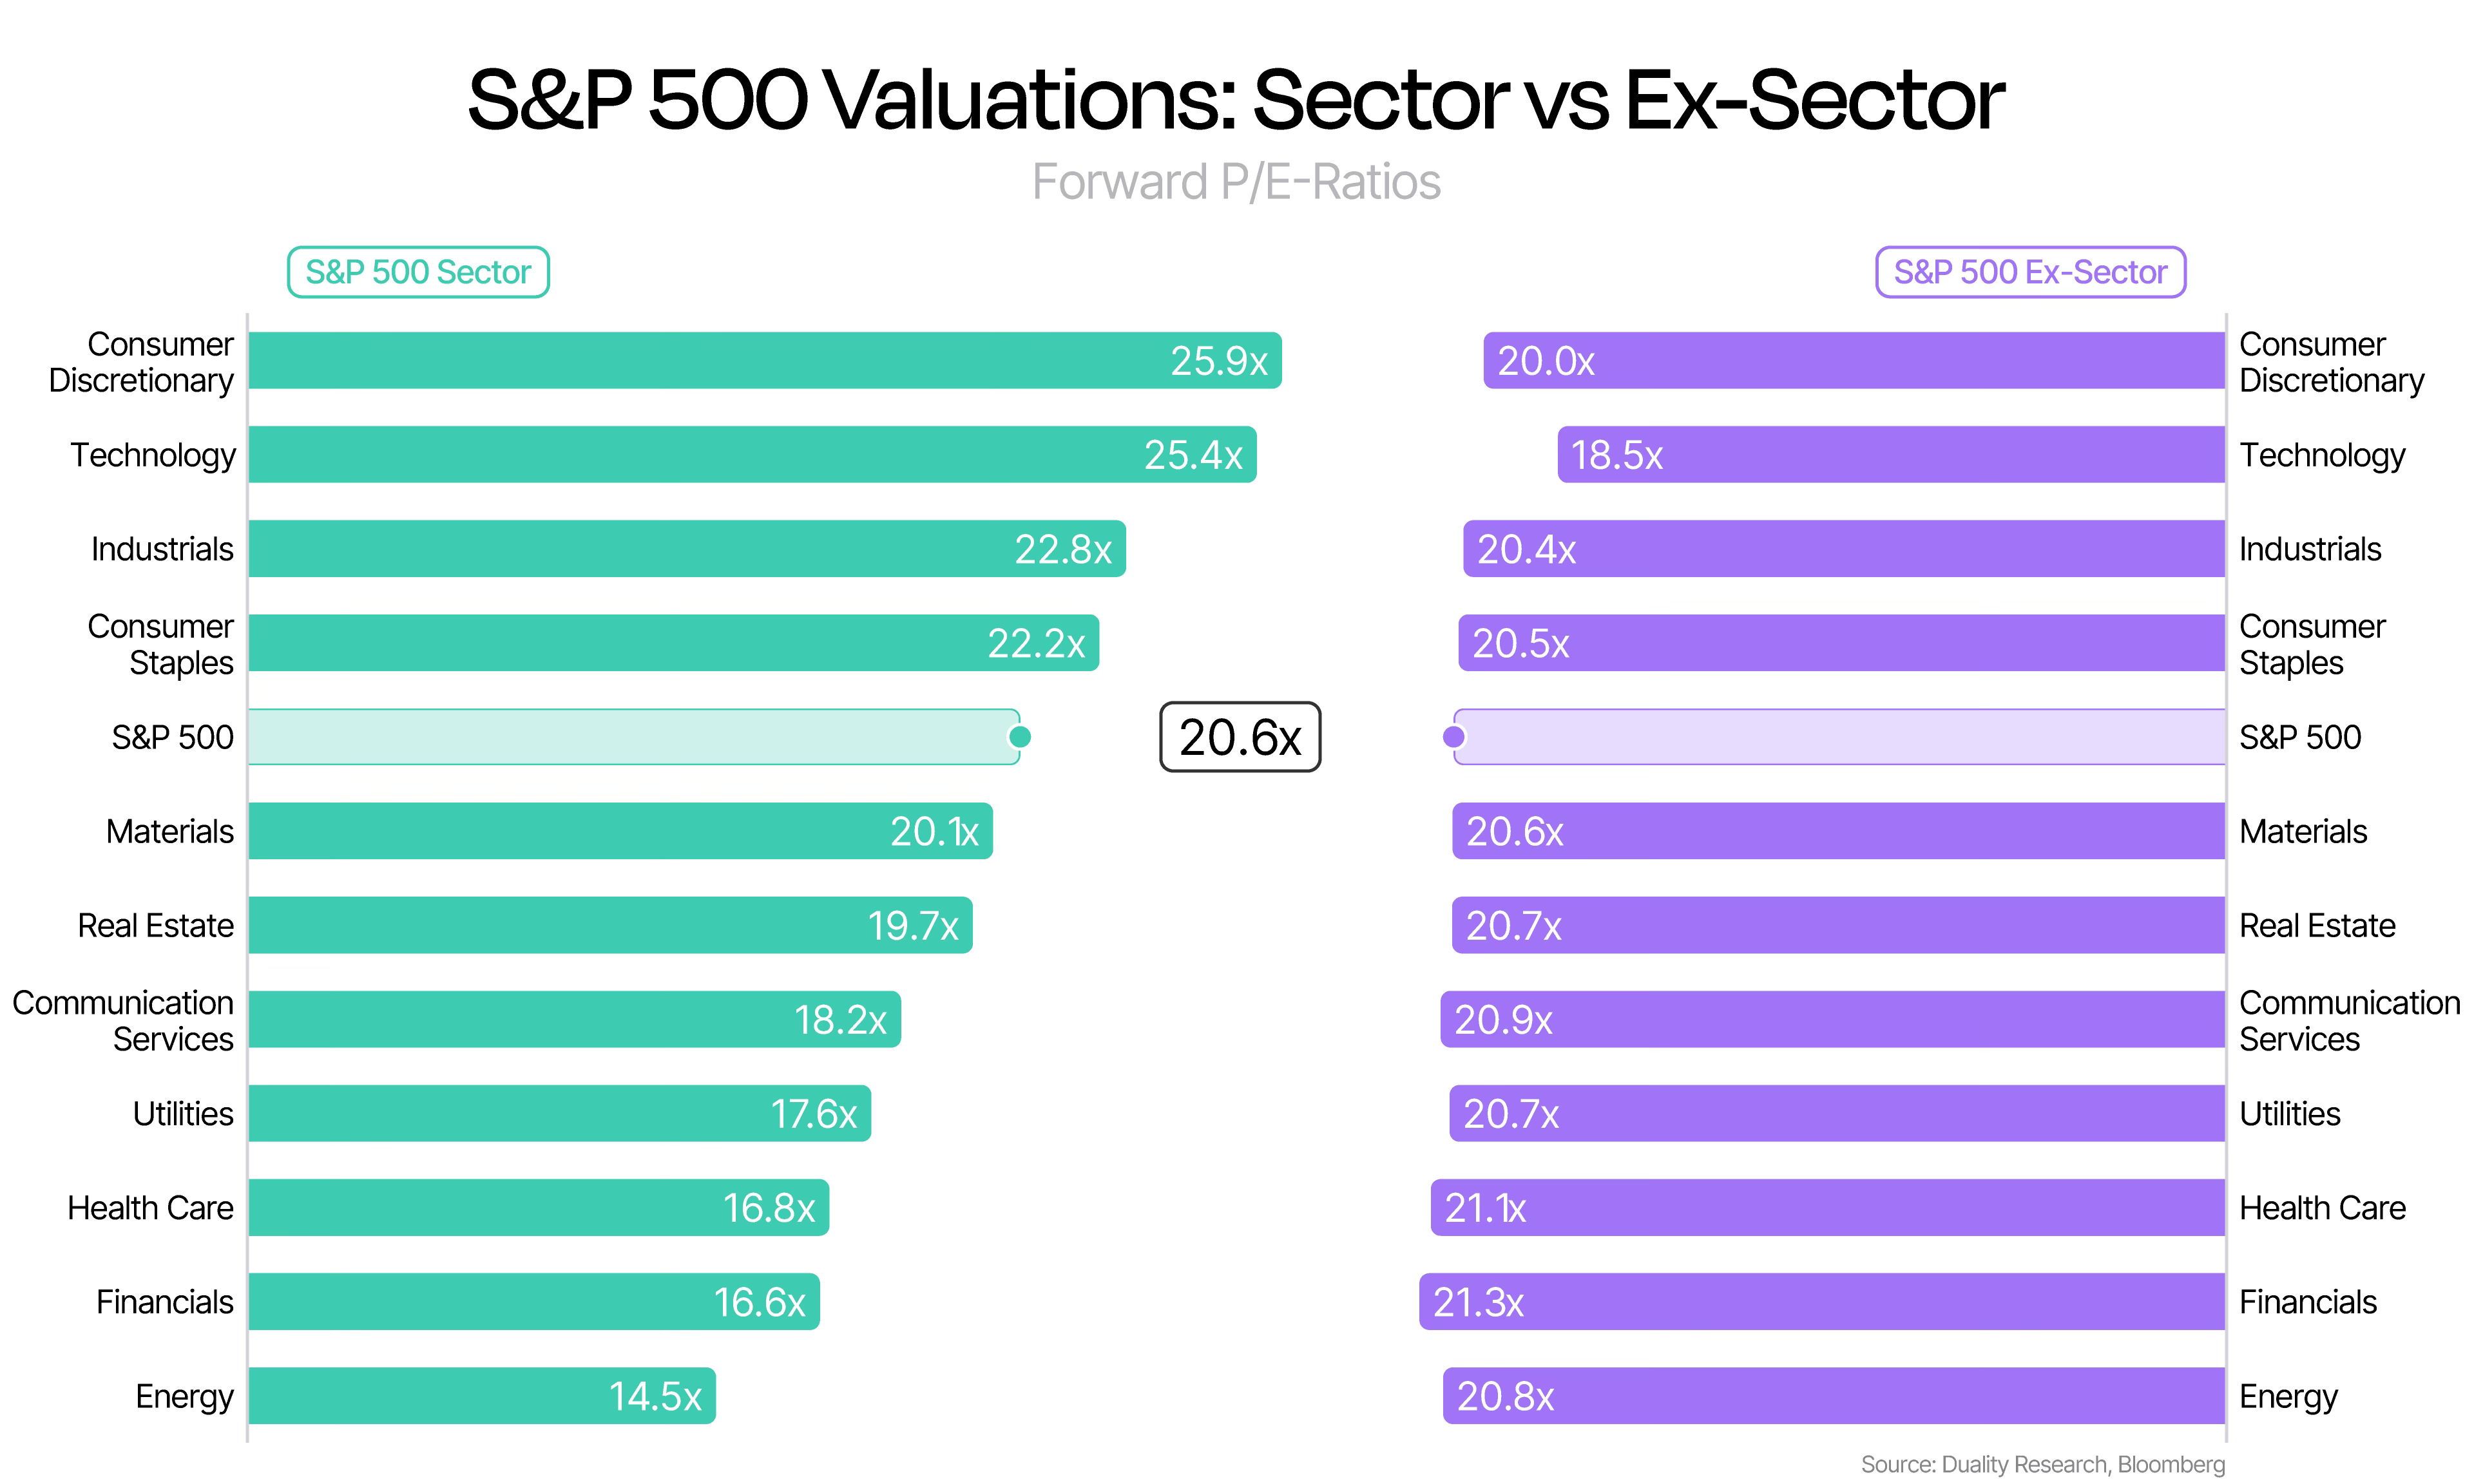

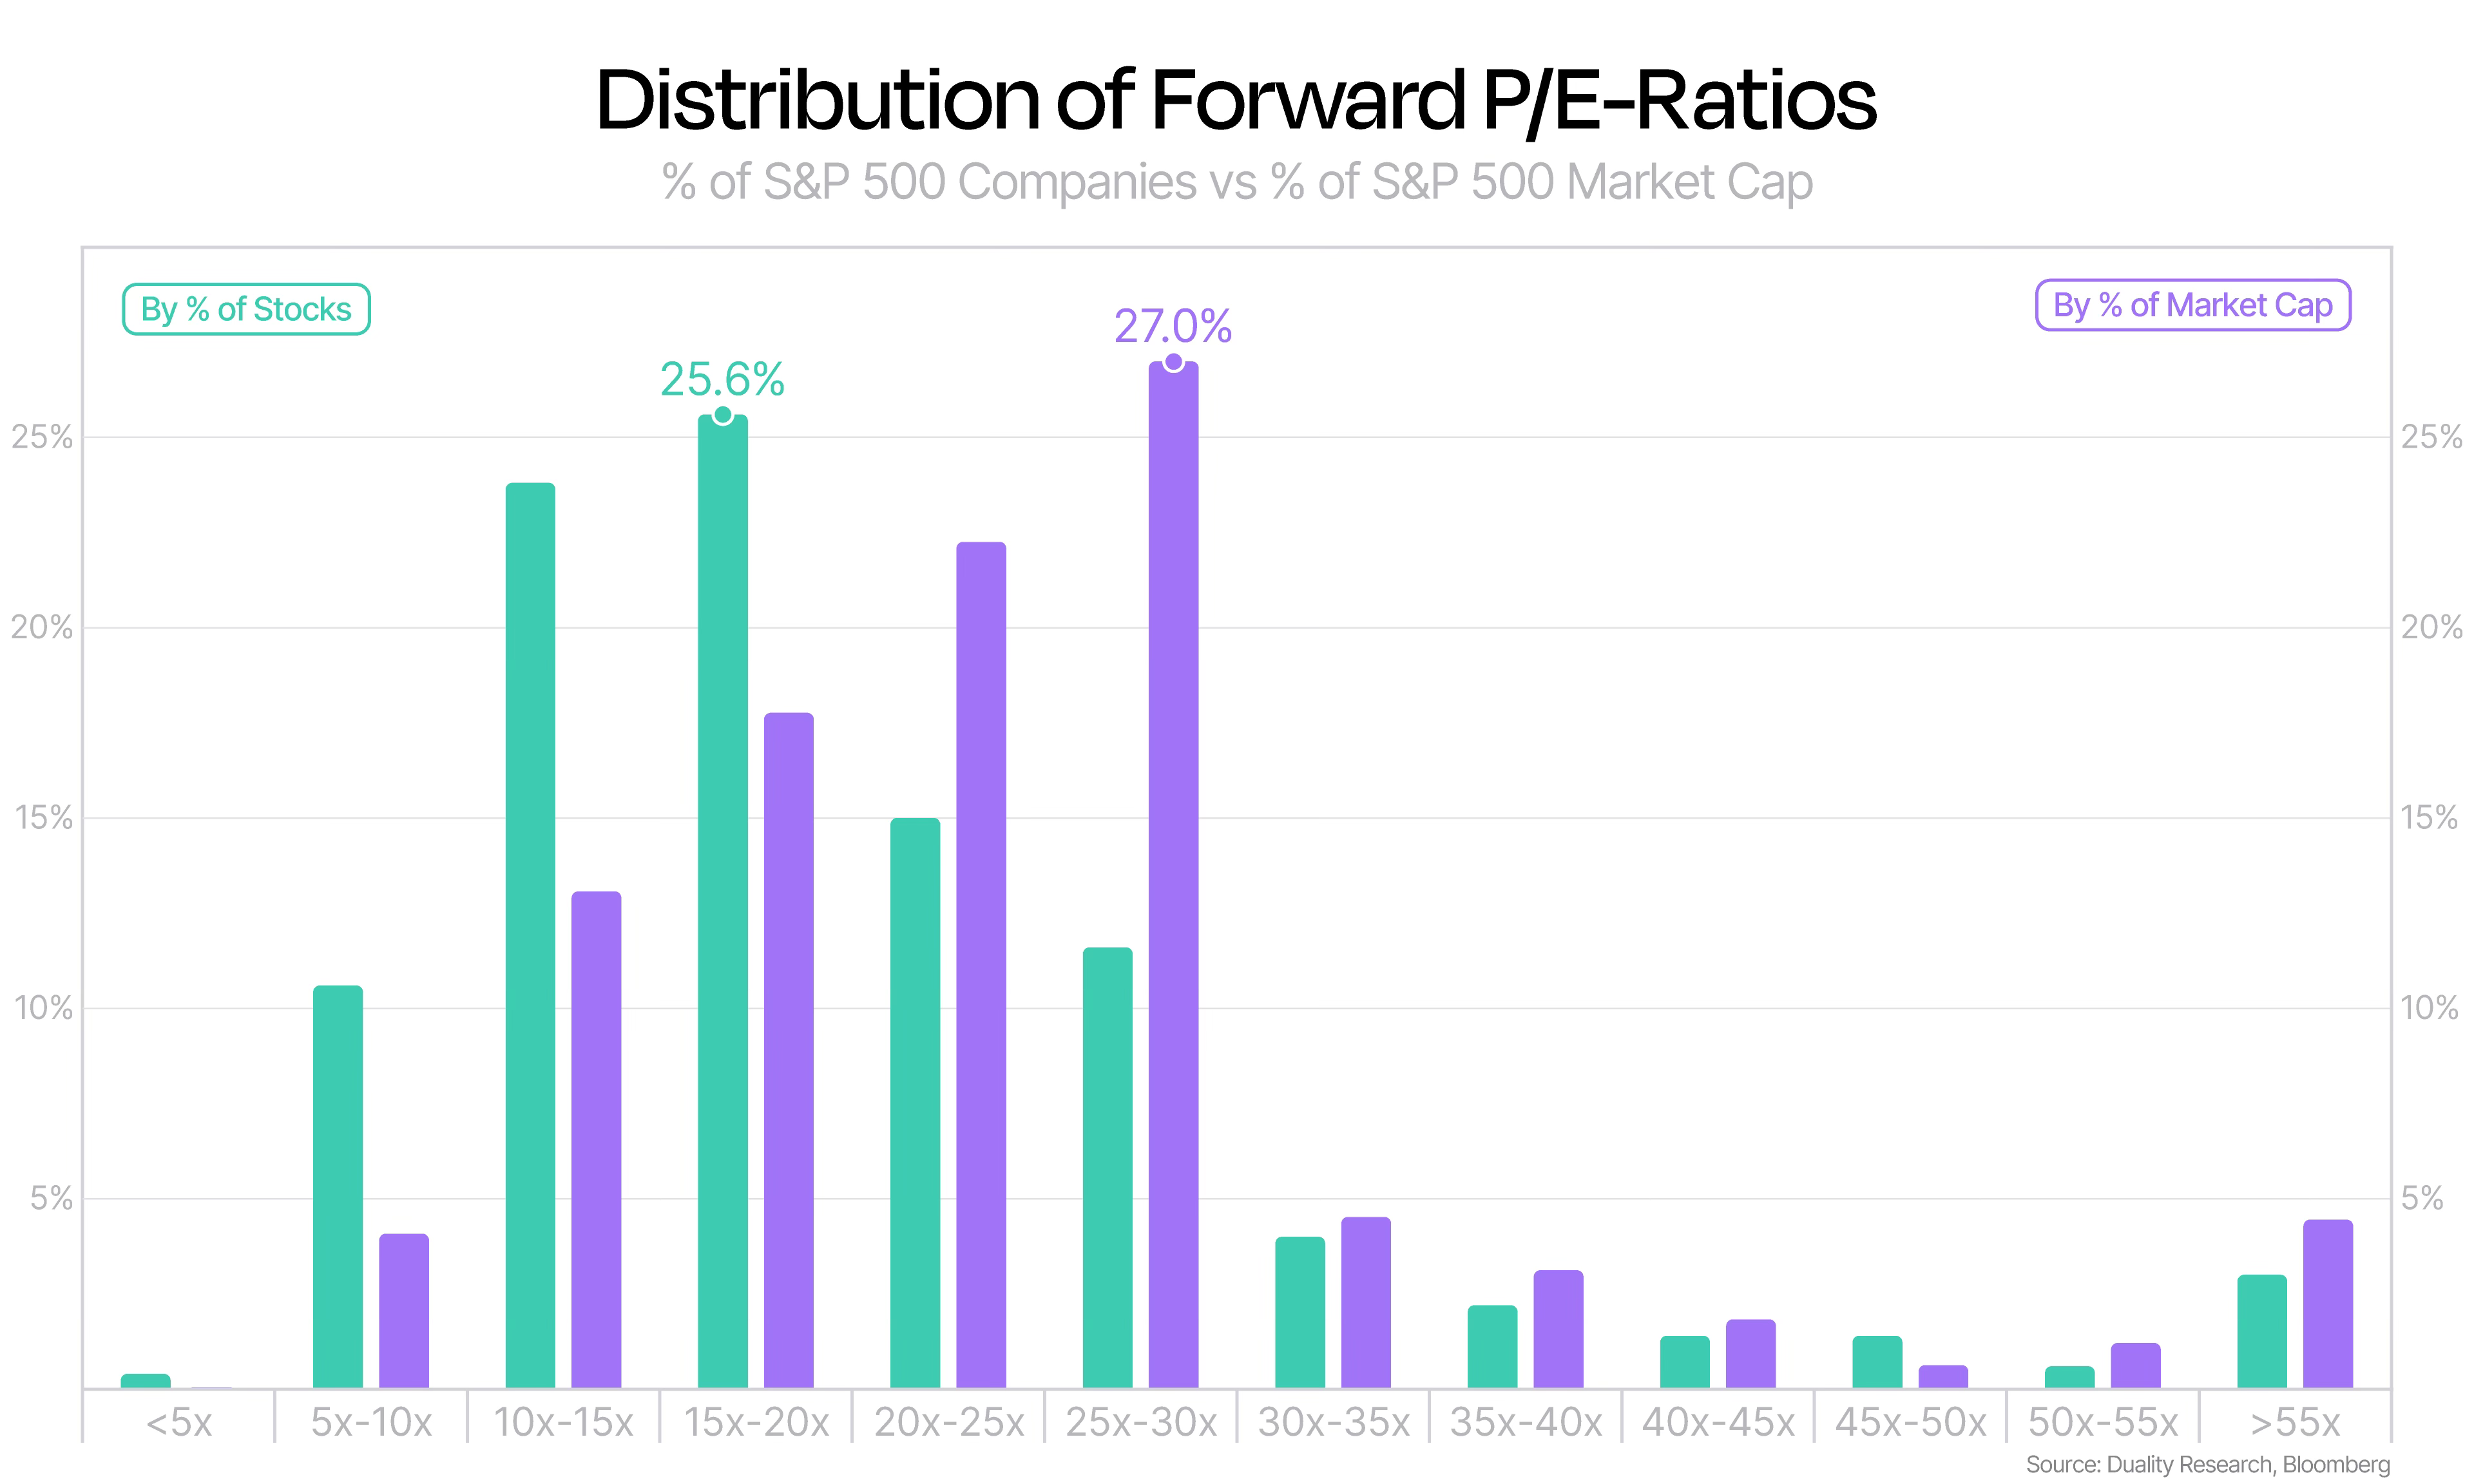
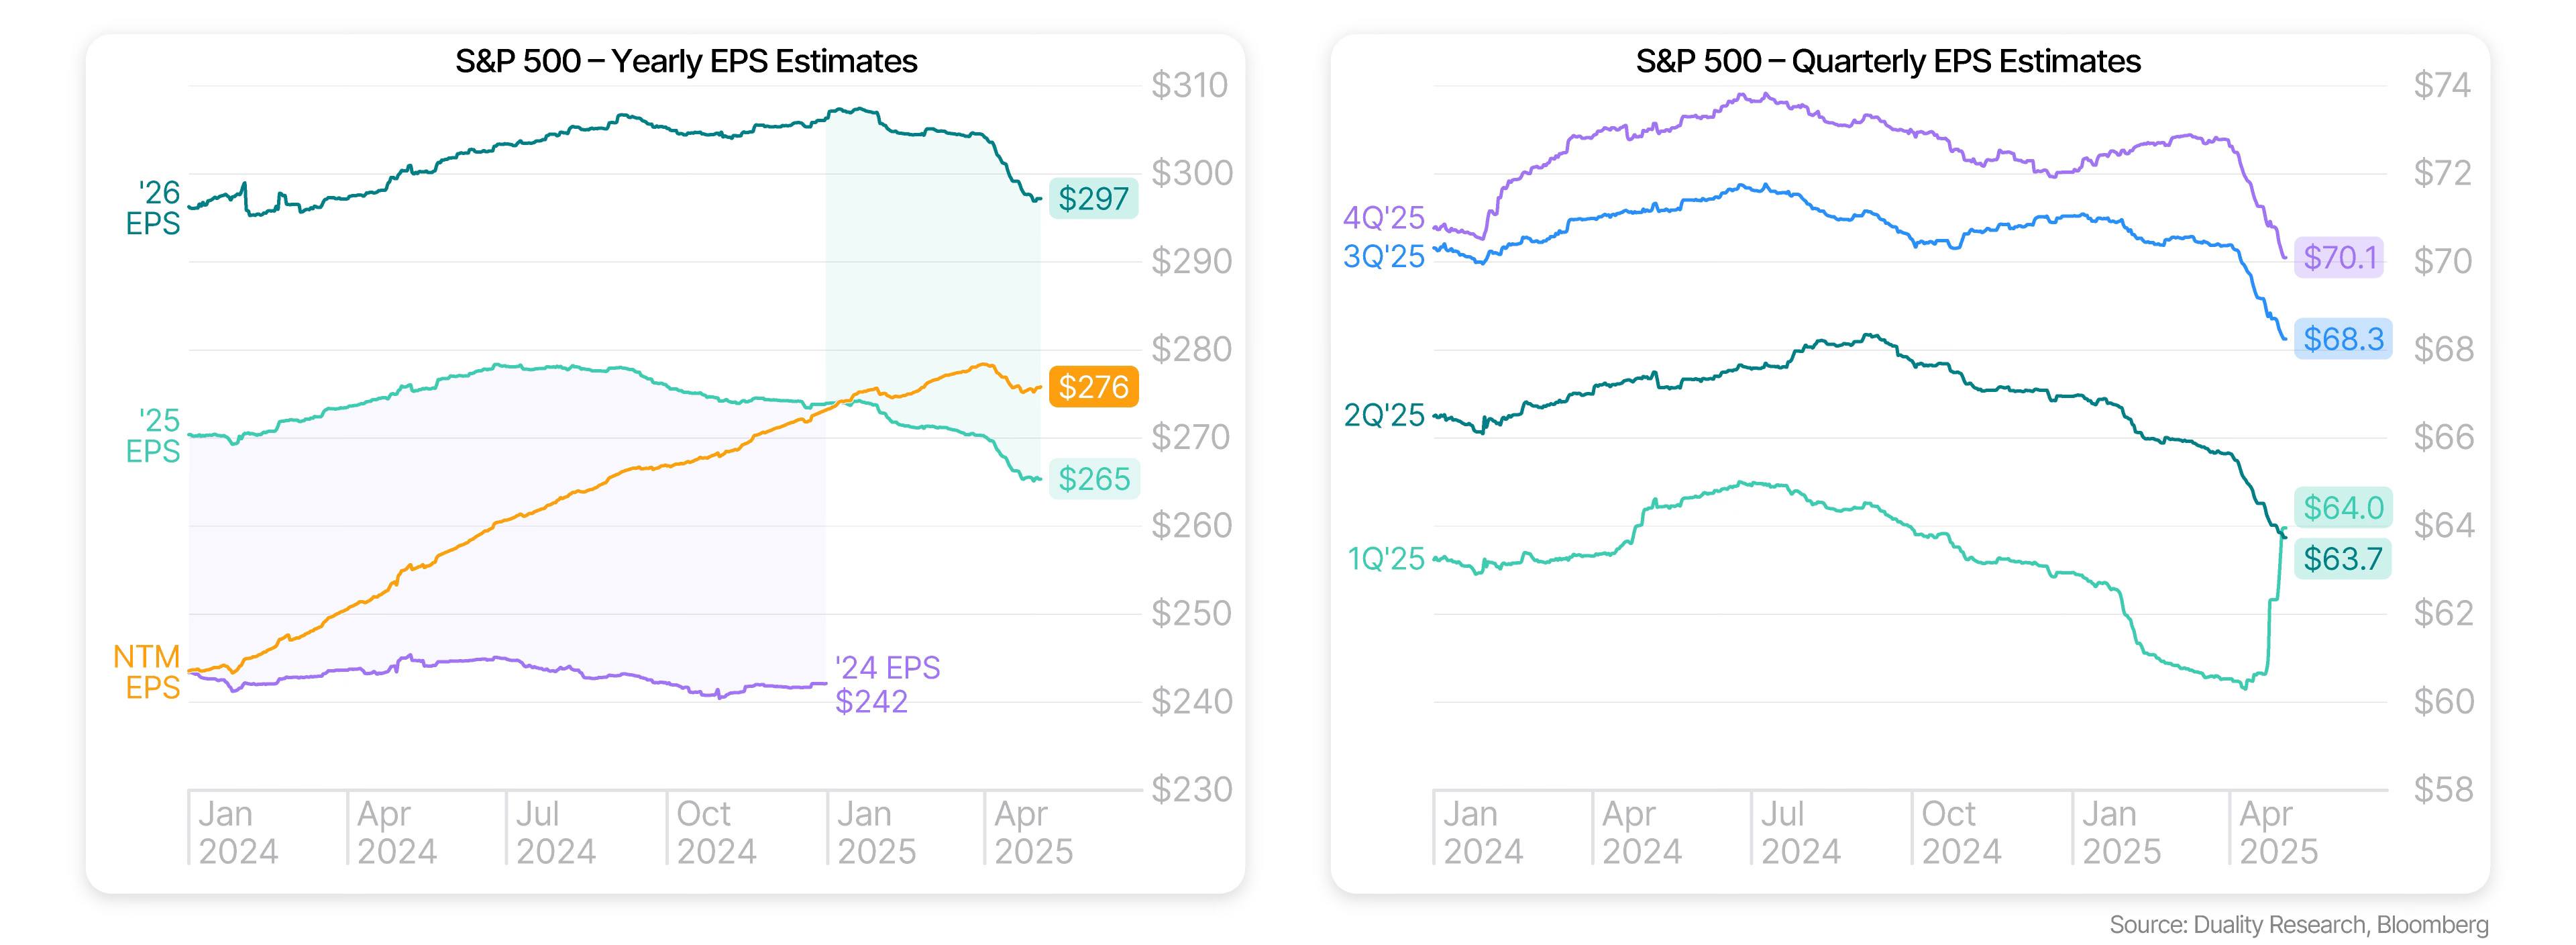
Earnings & Valuations
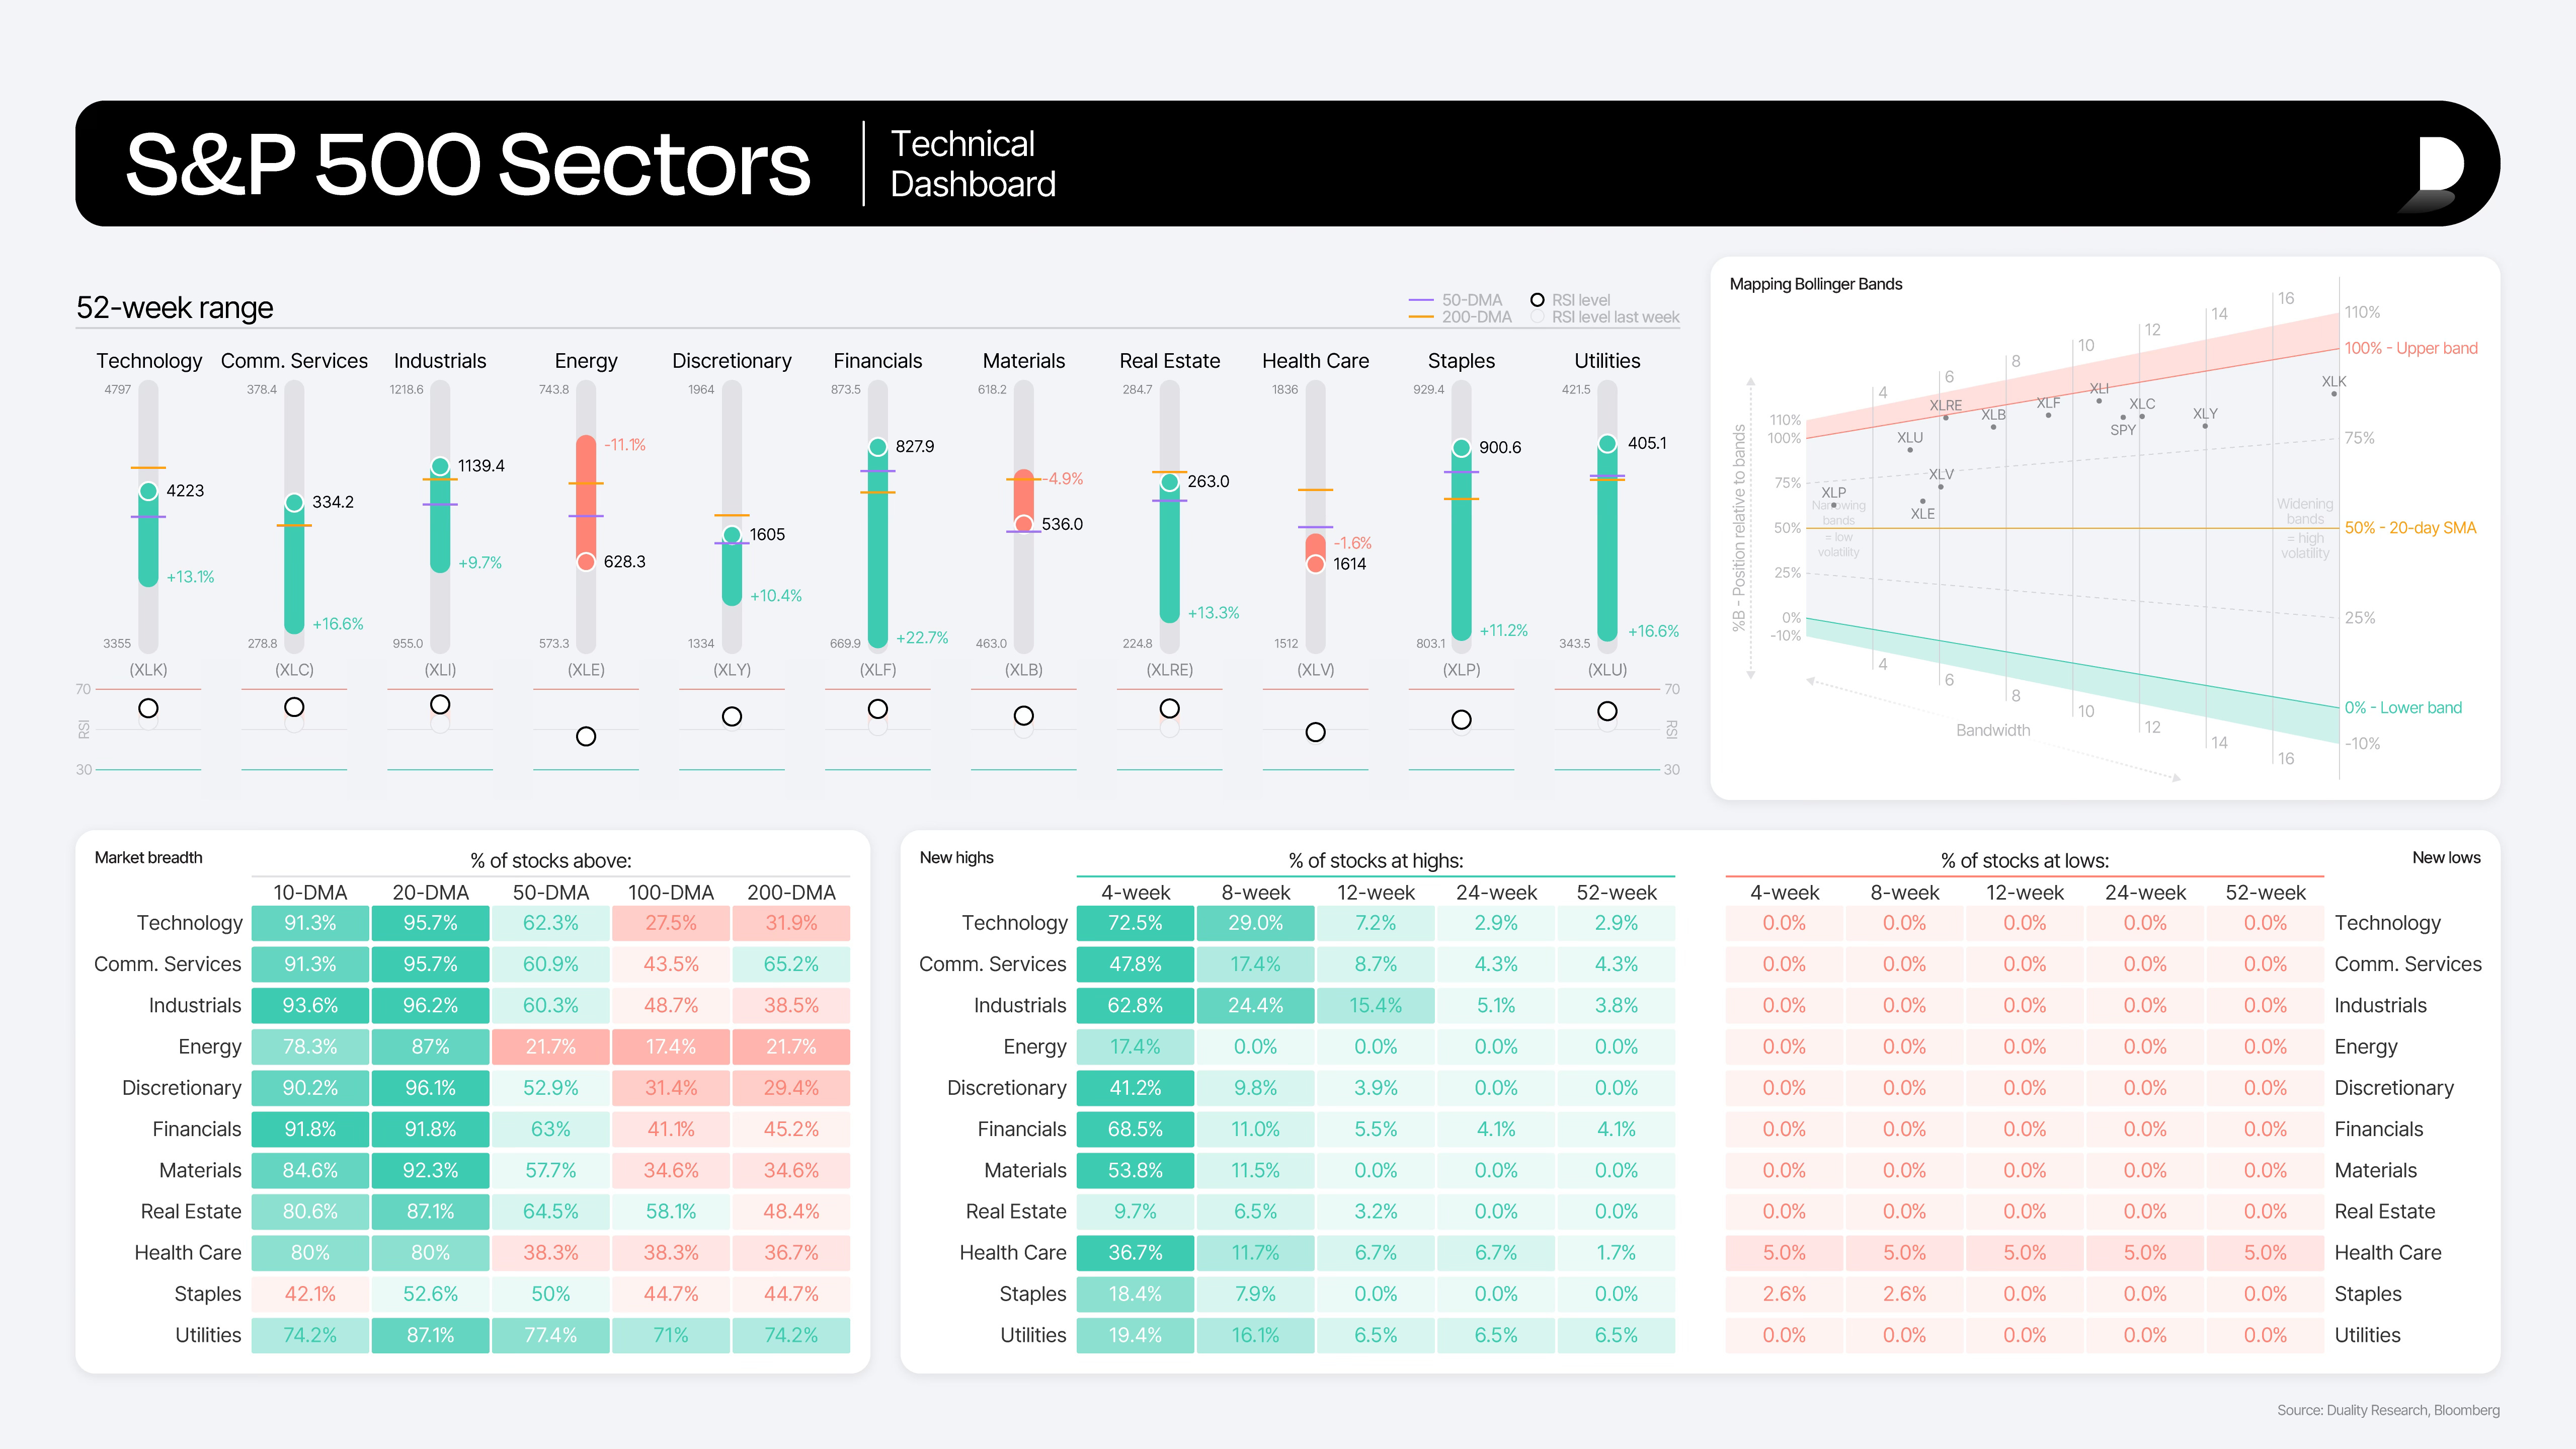
Technical Dashboard
This is a new dashboard, designed to give you a comprehensive overview at a glance.
Top Left: The candlestick section shows a 52-week candle for each sector, including the standard open / high / low / close, plus the 1-year performance and the 50-day and 200-day moving averages. Right below that is the current RSI, along with the value from a week ago for context.
Top Right: This section maps out the Bollinger Bands for each sector. You can kind of think of it like a Relative Rotation Graph – just a different way to look at sector movement. You saw it here first!
Bottom Left: Here’s your standard breadth data. Anything below 50 is in red, above 50 shows up green – quick and easy to scan.
Bottom Right: This is where we show the new highs and new lows across several timeframes, giving you a sense of momentum and trend shifts.
Hope you find this helpful! Let us know if you have any questions or feedback.