
Inside Our Market Playbook
Thoughts on the Market

The Fed cut rates for the first time in 12 months, and we’ve just gotten further confirmation that it’s highly likely they’re cutting into a recovery.
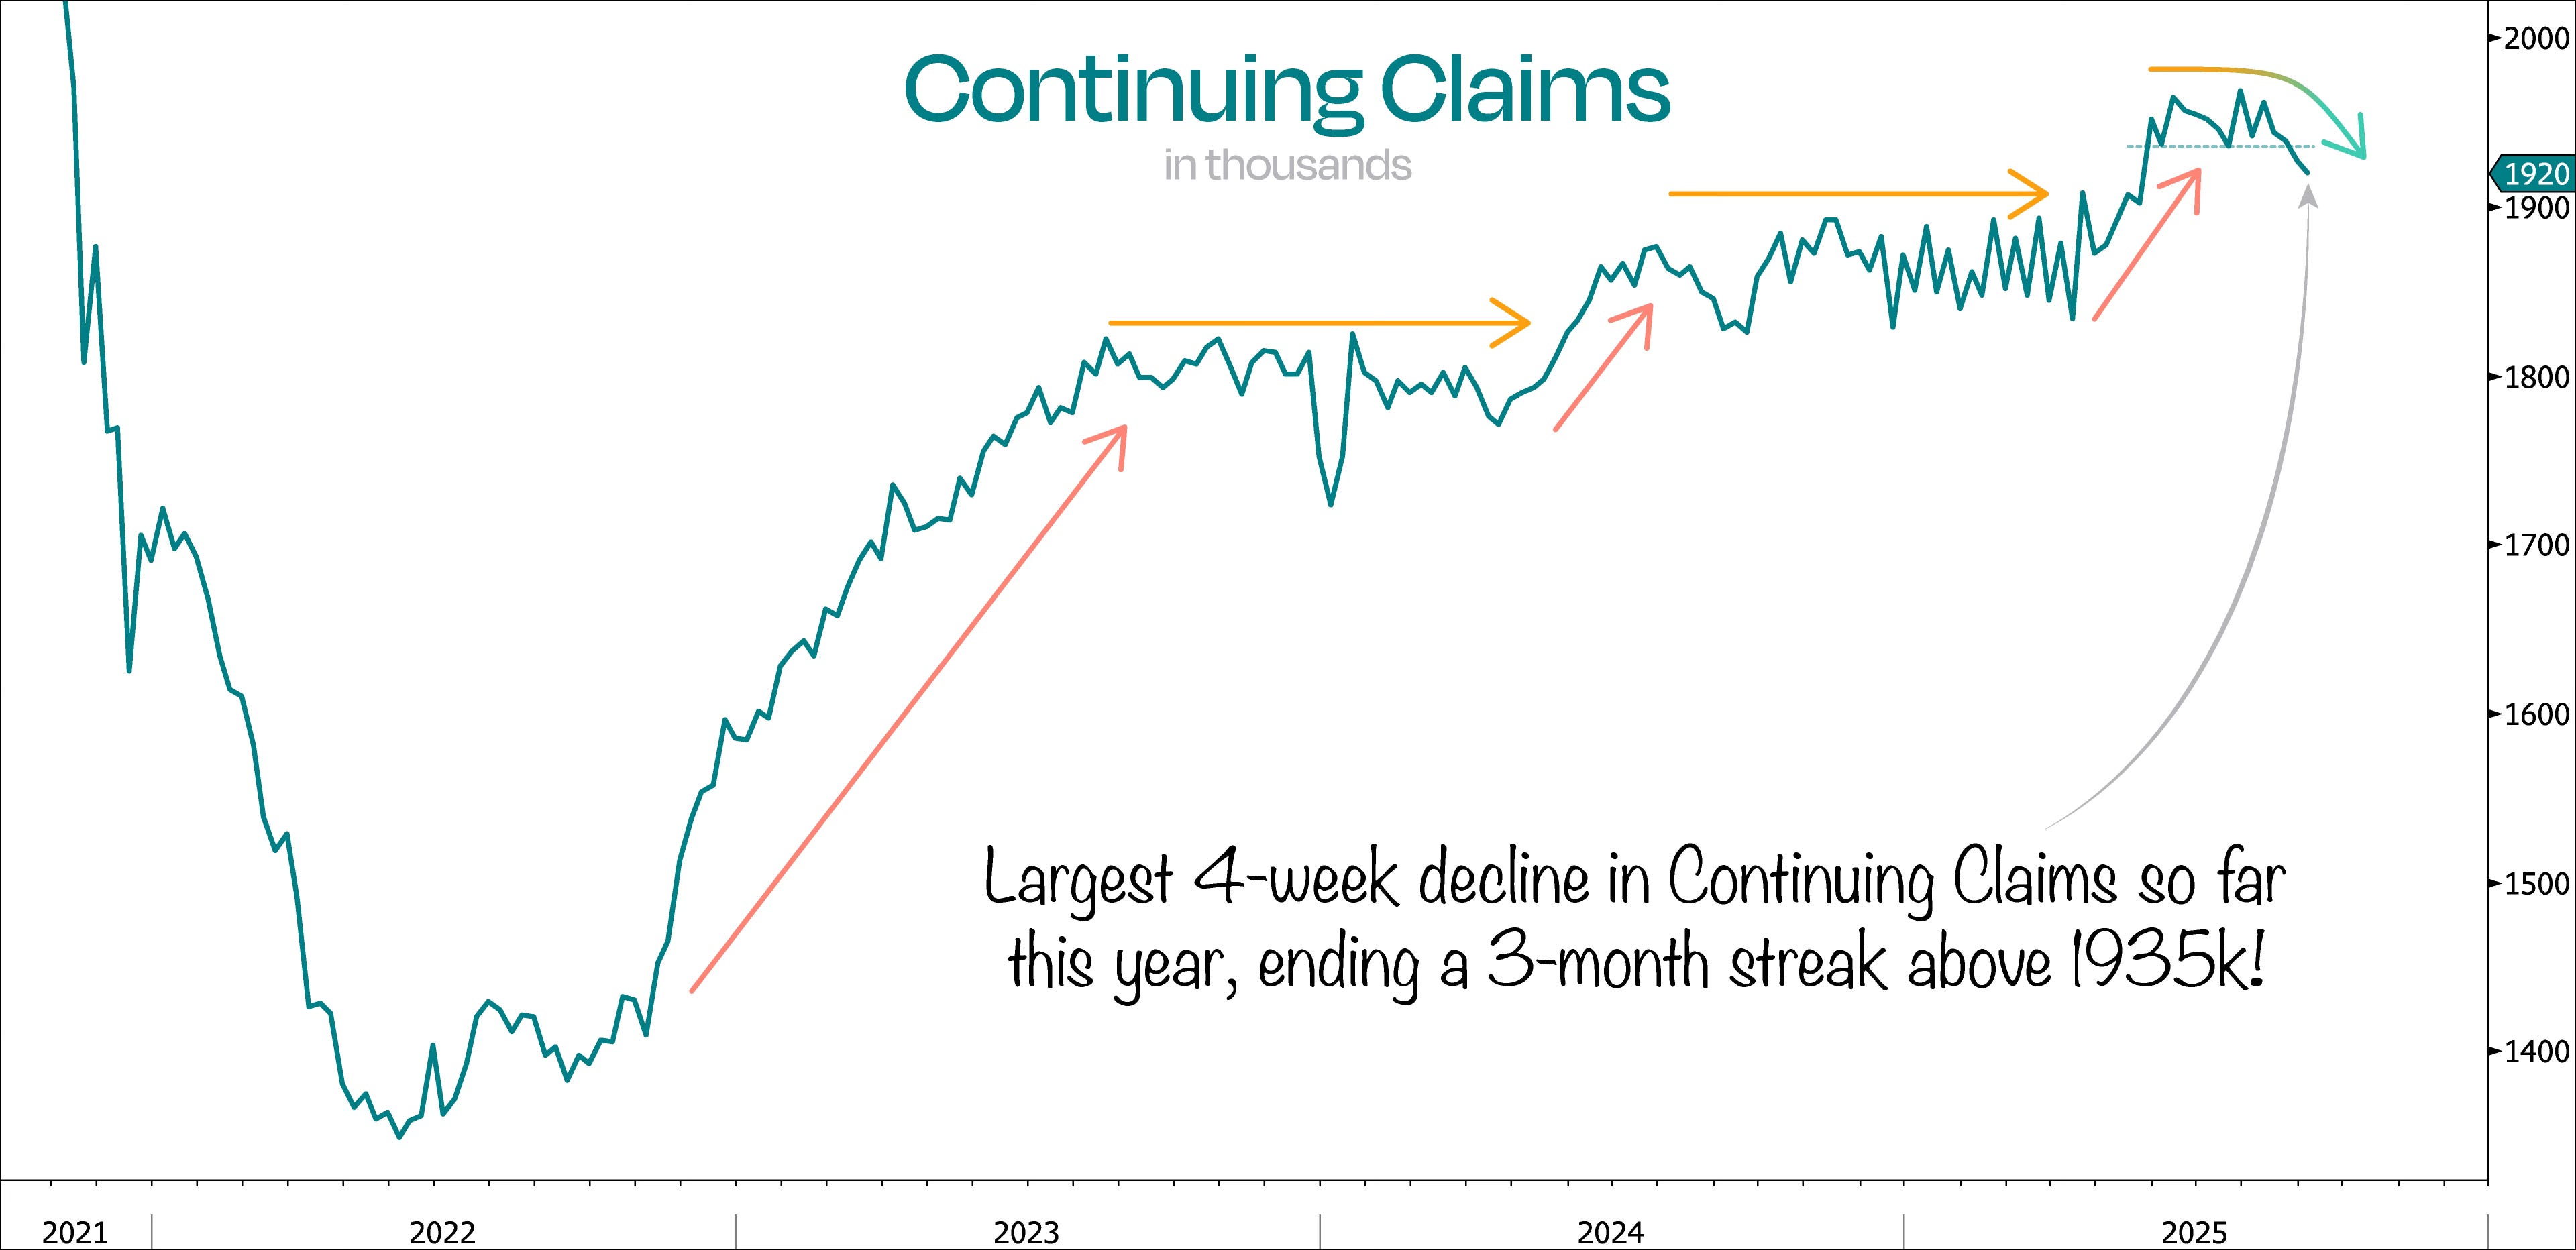
Last week’s Continuing Jobless Claim print came in 30k below expectations, causing the 4-week decline in Continuing Claims to be the largest so far this year — and finally ending a 3-month streak above 1935k.
If you remember what we said last week, this is basically the real-time scorecard for hiring vs firing. If the number goes up, more people are losing jobs than getting them; if it goes down, more jobs are being added than lost.
When the Fed cuts rates into a recovery — even though most investors think we’re still headed into a slowdown — that’s about as bullish as it gets for stocks. It’s exactly why we’ve been leaning further out on the risk spectrum lately.
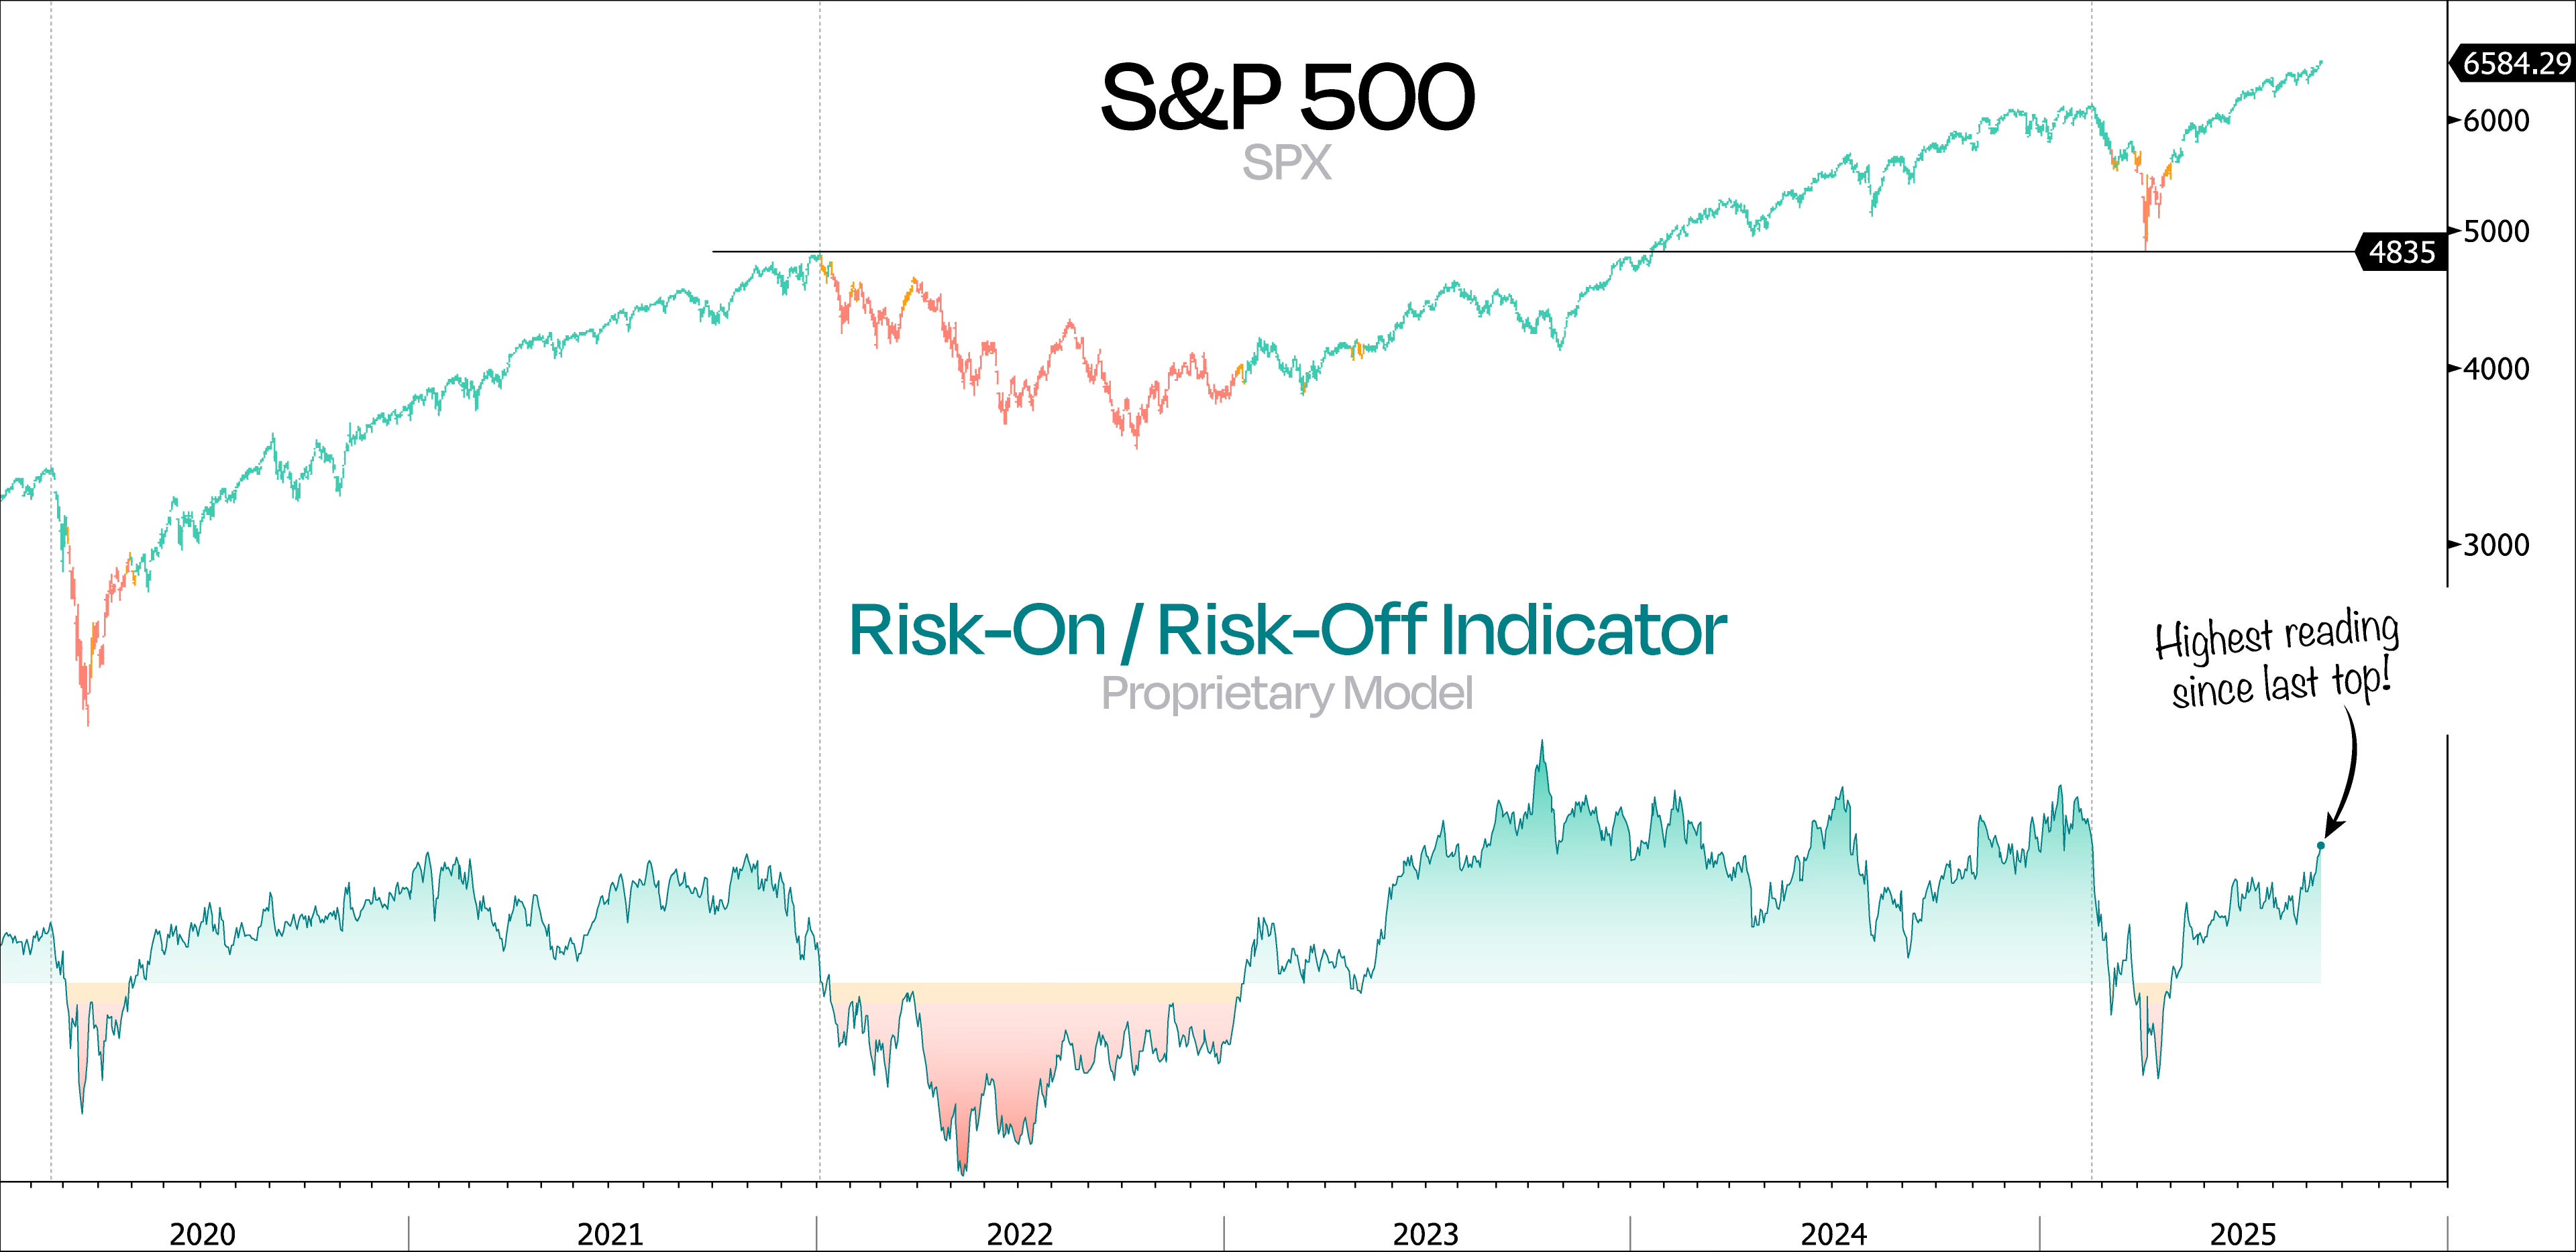
On top of that, our Proprietary Risk-On/Risk-Off Model has been flashing the same green light backdrop for equities, as we pointed out last week.
Given the number of questions we’ve received, we wanted to take this opportunity to share more about how we’re positioning and the framework behind our investment approach.
Whenever we put capital to work as investors, we believe it’s essential to understand the type of market environment we’re currently in. Over the past several years, our Proprietary Model has been invaluable in helping us do just that.
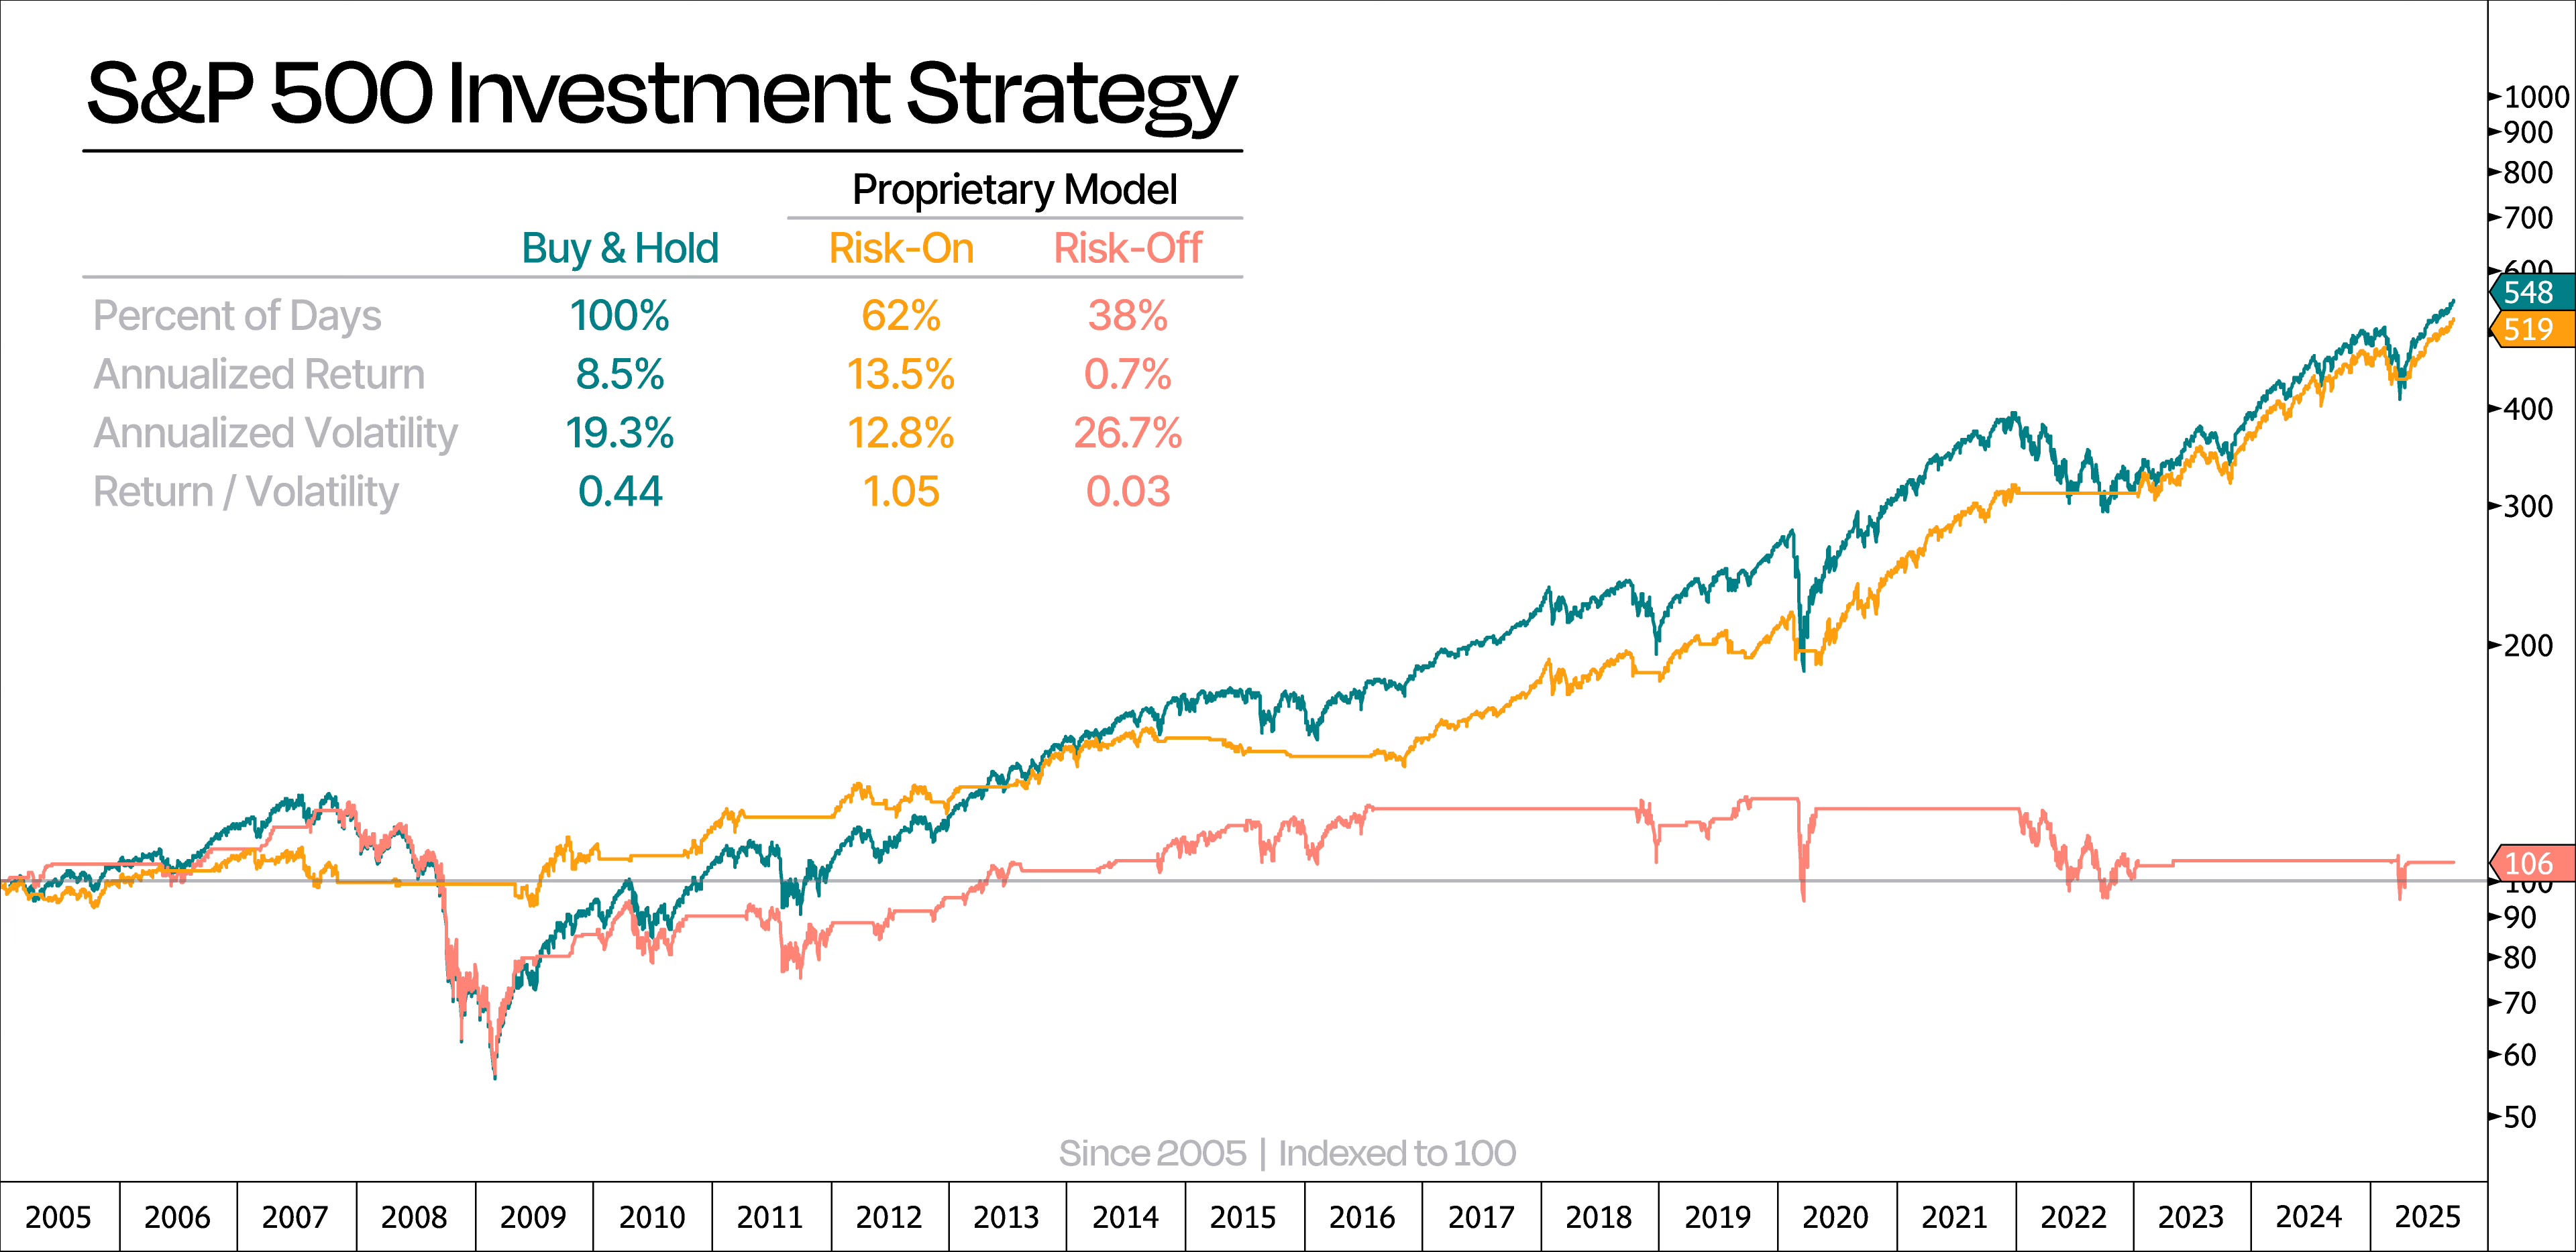
Take a look at the chart below. It compares S&P 500 returns from a plain buy-and-hold approach vs following our model’s signals.
Since full input data is only available from 2005 onward, our assessment focuses on the past 20 years of returns.
While our model hasn’t strictly outperformed the buy-and-hold approach, it has captured almost all of the S&P’s net gains — despite being invested only 62% of the time. That’s like taking nearly eight years off, parking money in short-term Treasuries, and still ending up ahead of buy-and-hold.
What this really means is our model zeroes in on the sweet spots — periods when risk-adjusted returns are unusually strong — while steering clear of those choppier, high-volatility stretches.
If you’ve been reading our research for a while, you’ve probably noticed that we’ve consistently highlighted that we remain in a bullish Breadth Thrust Regime since May 12.
In simple terms, a deGraaf Breadth Thrust signals the start of a new bullish regime that typically lasts about a year. For us, this signal has become a key prerequisite before putting money to work aggressively.
A deGraaf Breadth Thrust is triggered when 55% or more of S&P 500 stocks close at new 20-day highs.
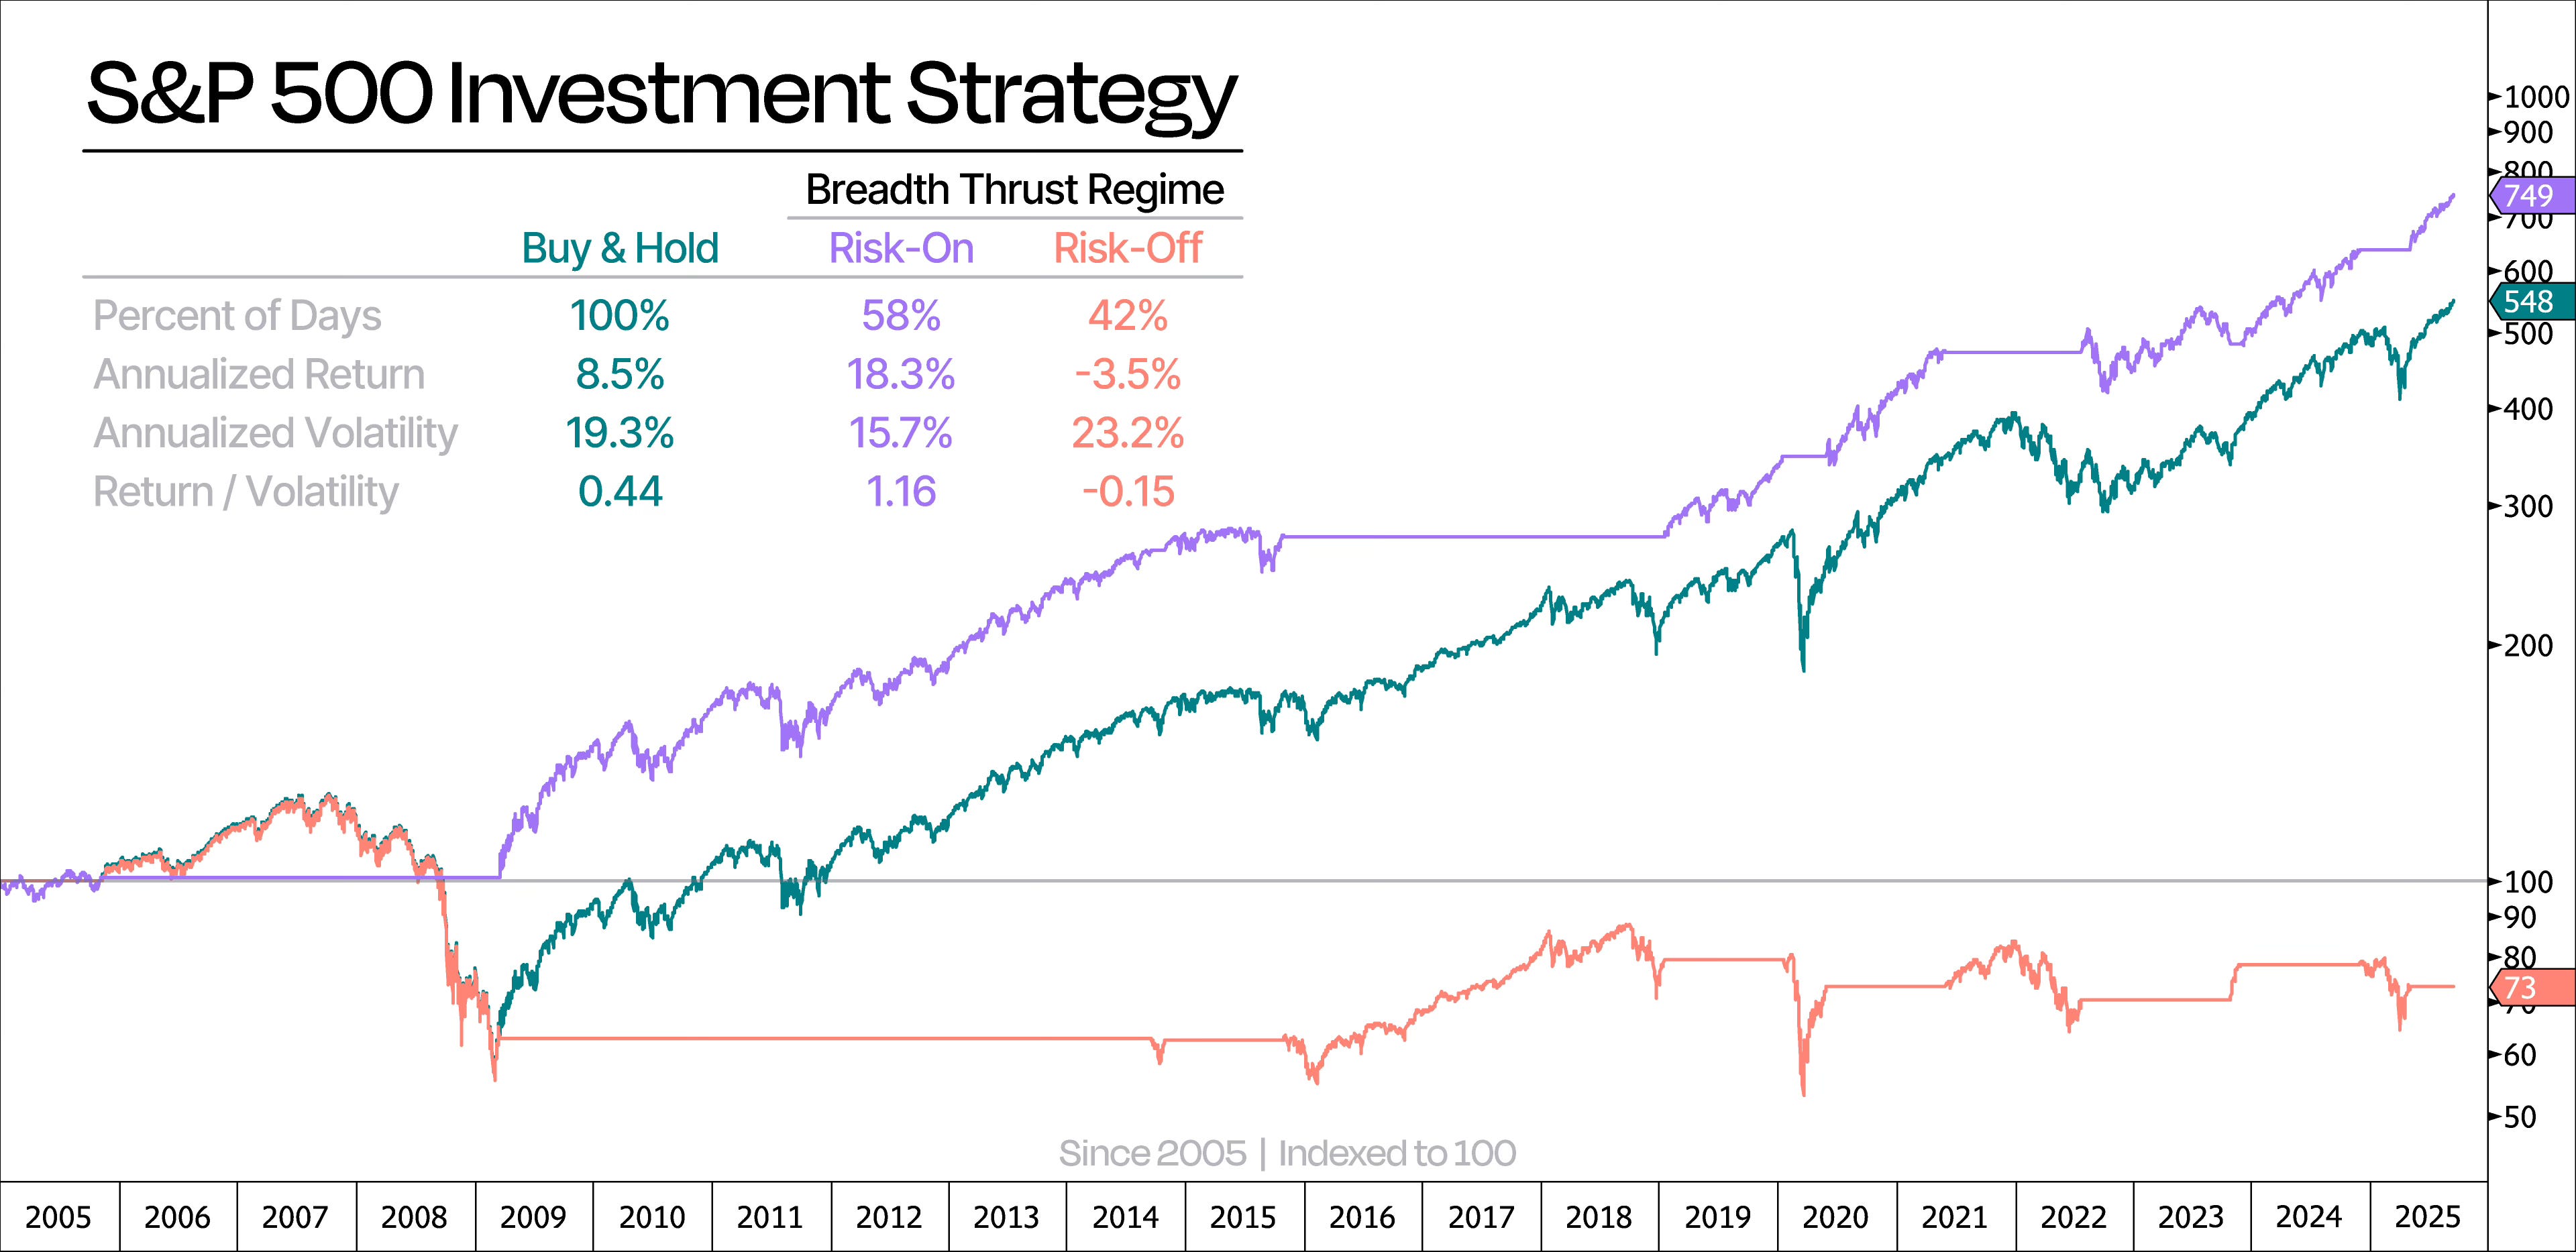
Take a look at the chart below. It shows how the S&P 500 performs if you just buy-and-hold vs only investing during Breadth Thrust Regimes.
Following Breadth Thrust periods has comfortably outperformed buy-and-hold, despite being invested just 58% of the time — that’s just 12 years in the market since 2005.
In short, this strategy doesn’t just boost returns; it nails the best risk-adjusted market moments.
At Duality Research, our main risk-on/risk-off framework actually combines the two strategies. The rule is simple: if either strategy signals risk-on, we’re in the market.
This way, we capture more upside — though it slightly moderates the overall annualized return.
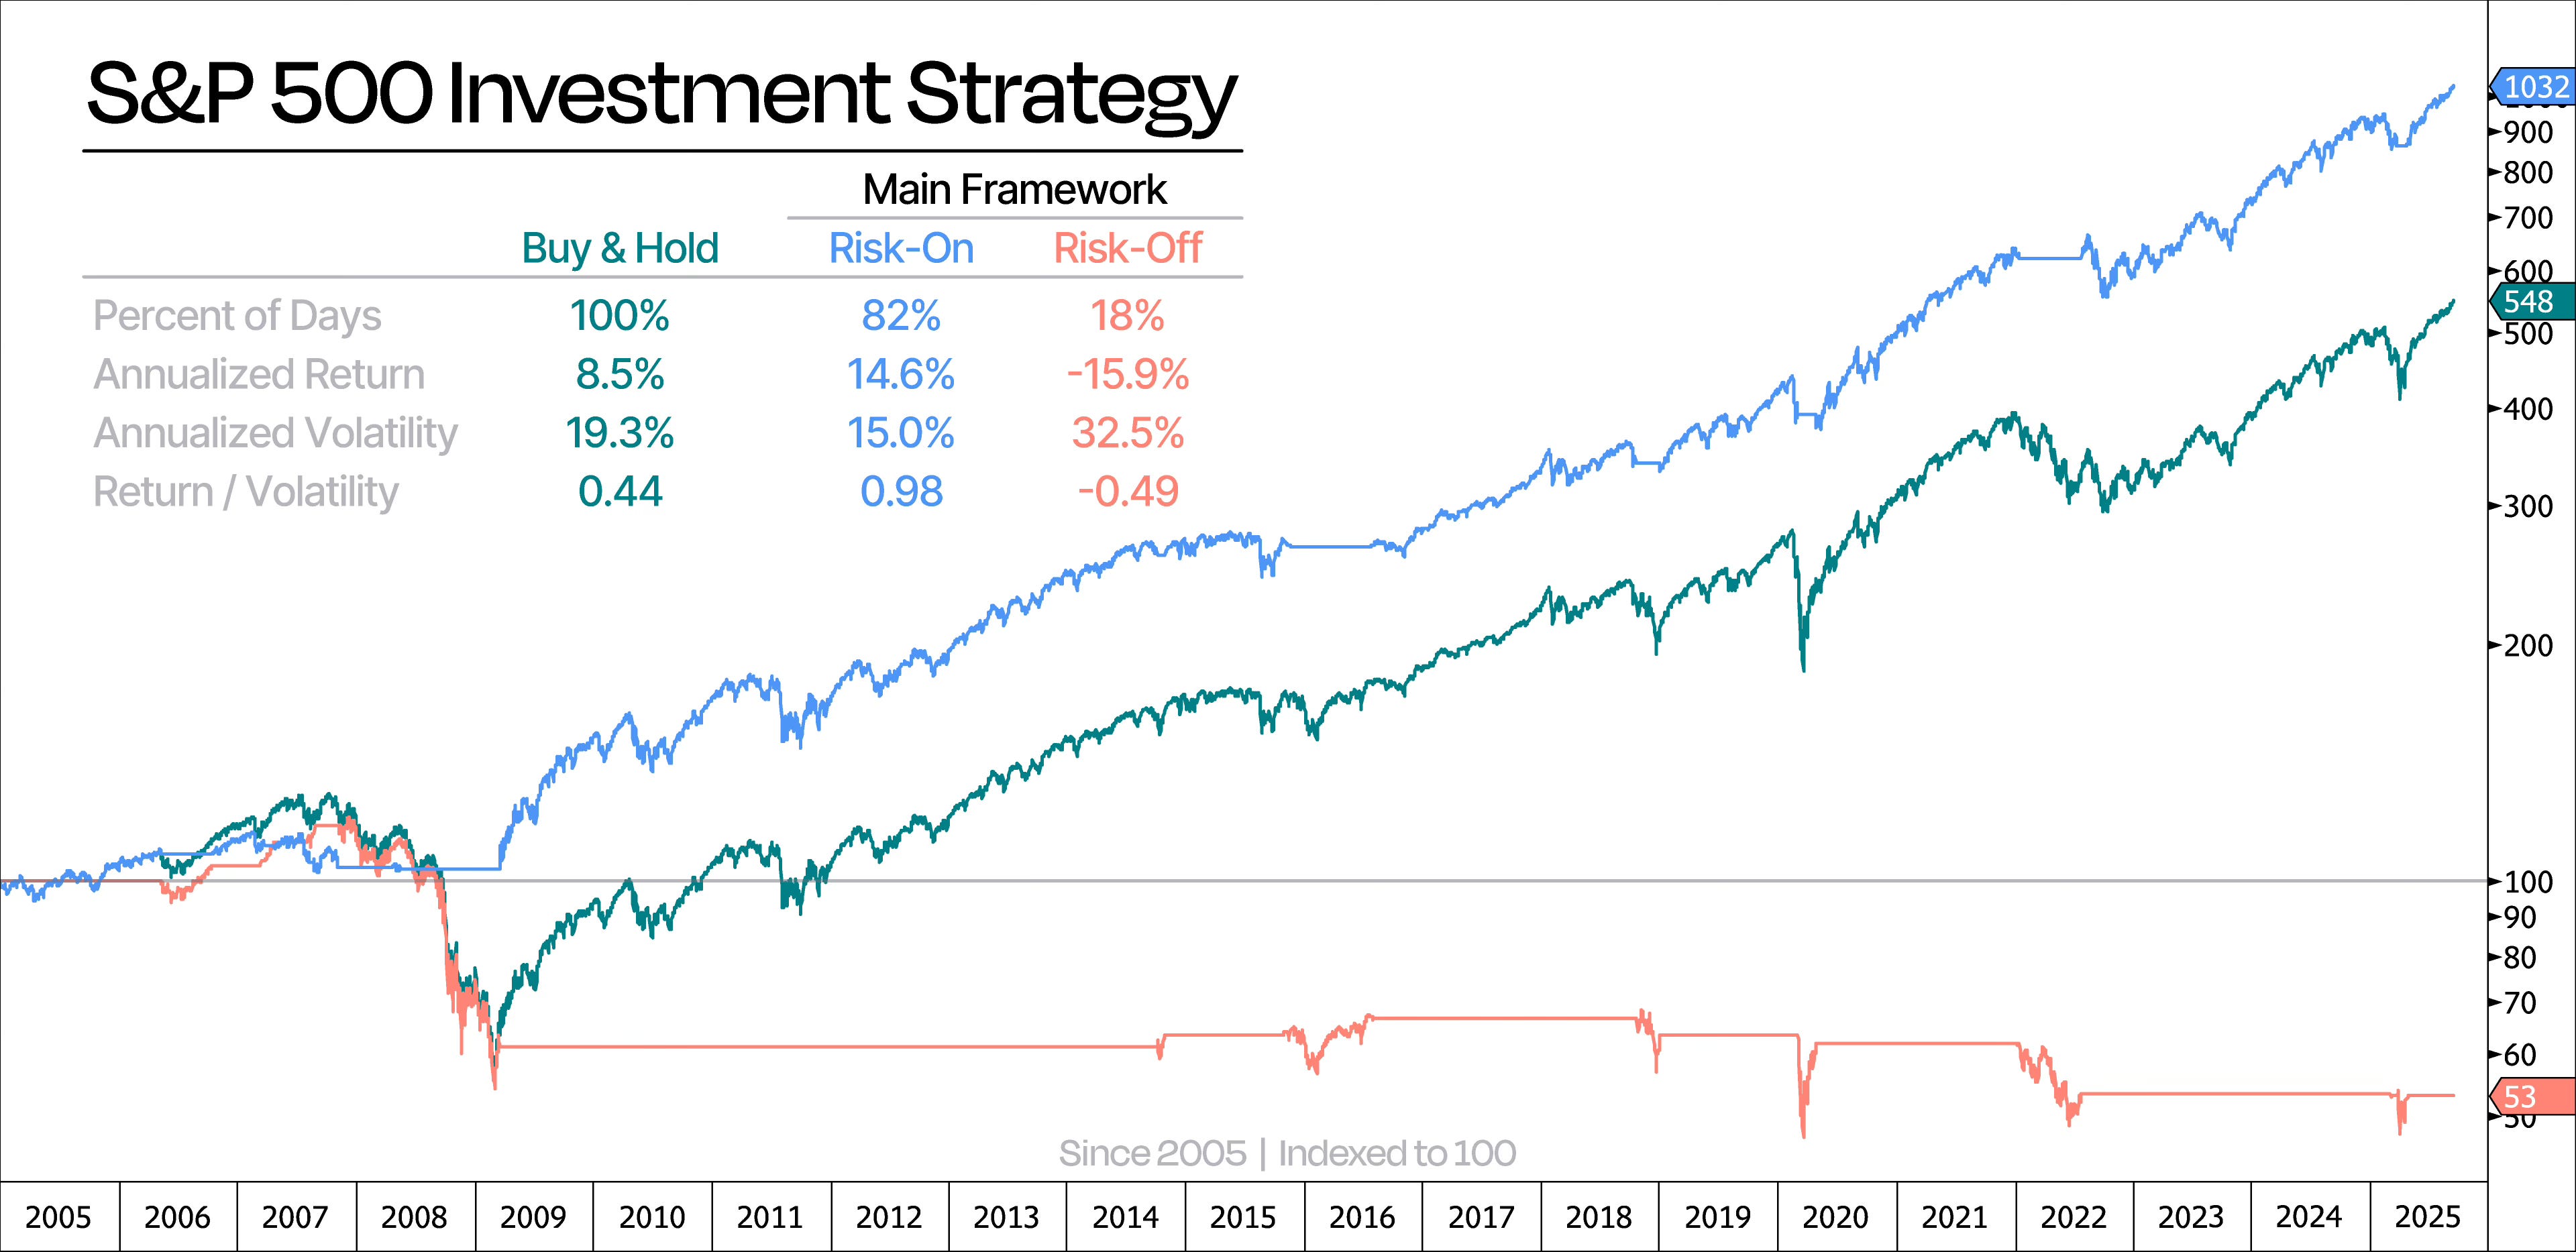
Take a look at the next chart. It shows our combined approach, which we call the Main Framework, alongside the classic buy-and-hold approach.
As you can see, this strategy keeps us in the market most of the time (82%), squeezing out the most net gains while largely avoiding periods of extreme market stress.
In fact, it would’ve steered clear of about 3.5 years (18%) when the market tanked with annualized losses of -15.9% — basically skipping the periods when the market was cut in half.
Compared with plain buy-and-hold, we can see that our Main Framework returns more than double the return per unit of volatility — in other words, double the bang for your buck in return per unit of risk.
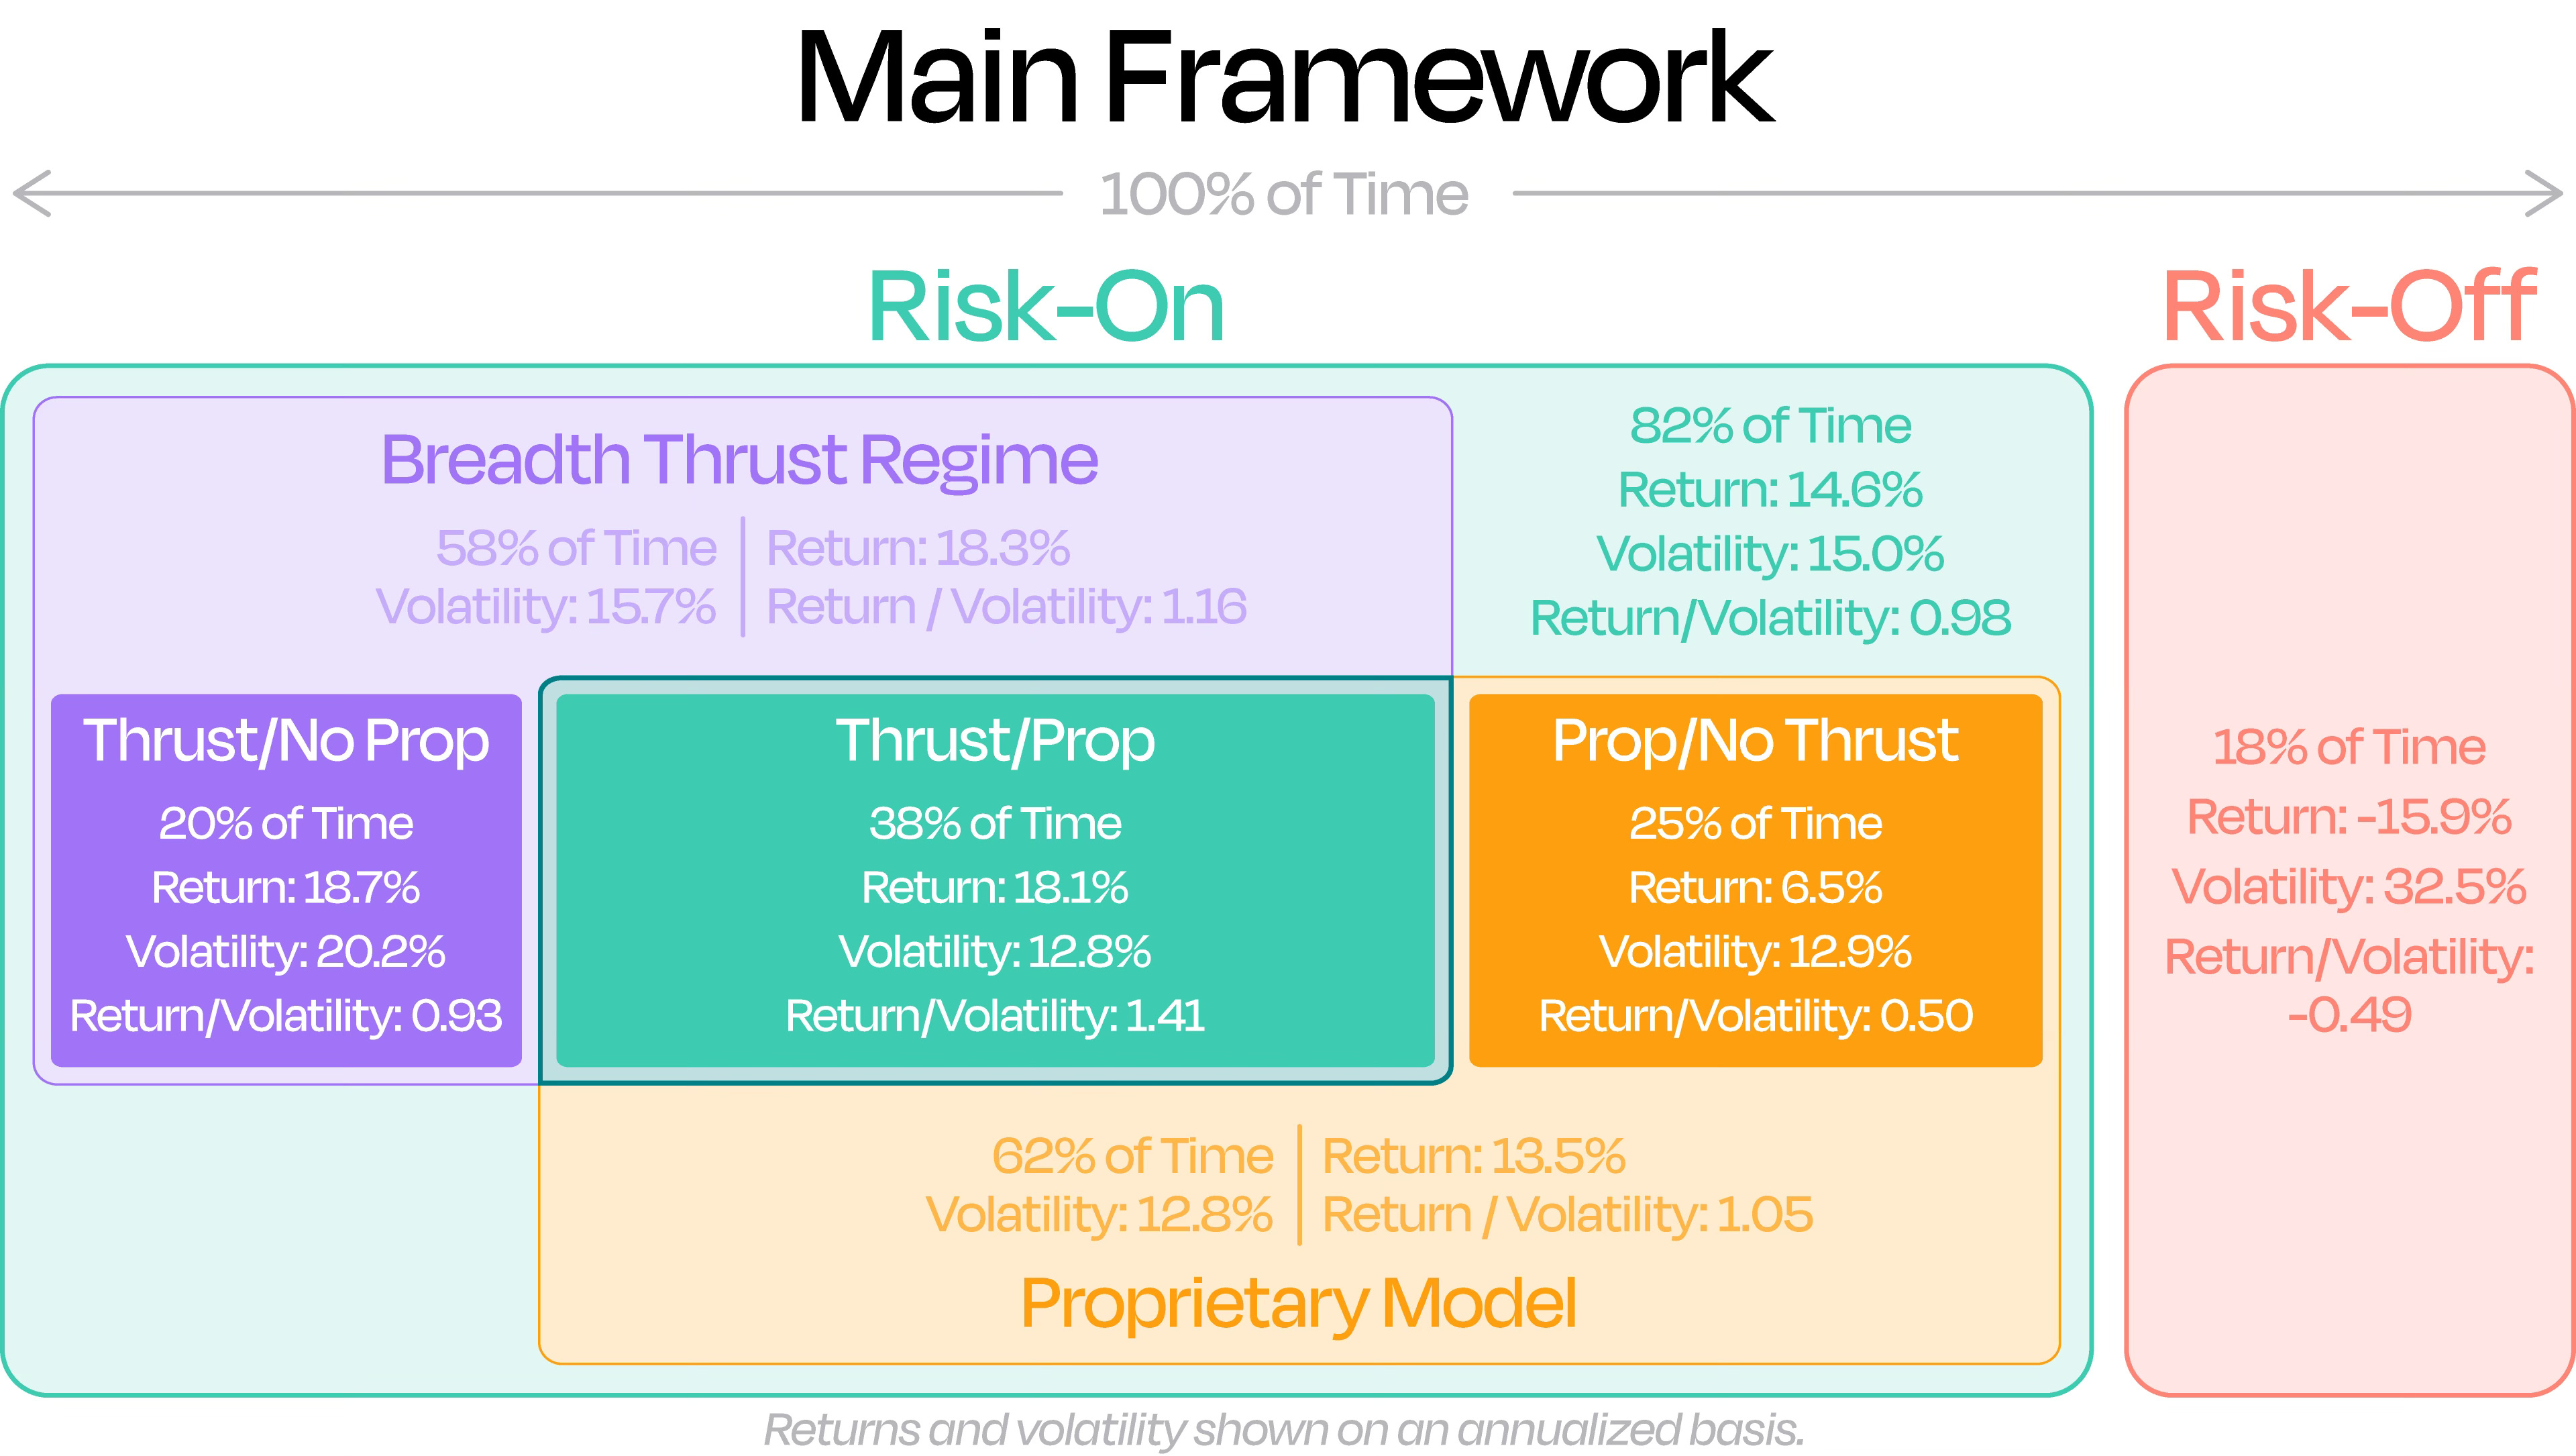
By combining our Proprietary Model with the Breadth Thrust Regimes, we basically get three stages in our Main Framework:
Thrust / No Prop
(Breadth Thrust Regime ✅, Proprietary Model ❌)Thrust / Prop
(Breadth Thrust Regime ✅, Proprietary Model ✅)Prop / No Thrust
(Breadth Thrust Regime ❌, Proprietary Model ✅)
We looked at each one on its own, and here’s the takeaway:
Thrust / No Prop delivers the highest annualized returns at 18.7%, likely because it catches those big bounce-back moves after sharp selloffs.
Thrust / Prop is close behind at 18.1%, but it shines when you look at risk-adjusted performance.
Prop / No Thrust lags in raw returns, but still beats buy-and-hold on a risk-adjusted basis. Think of it as the extra squeeze outside of Breadth Thrust Regimes.
Each stage does its part, and together they give us a clearer picture of where the opportunities are.
That said, with a Breadth Thrust Regime in place and our Proprietary Model deep in risk-on mode, we’re sitting in the sweet spot of our Main Framework — where returns really shine. Historically, this is when we see the strongest risk-adjusted performance — over three times the return per unit of volatility compared to just holding the S&P 500.
Clearly, our Main Framework has done a great job identifying sustained rallies that have mainly come with limited drawdowns — the exact moments when it makes sense to take on a bit more risk, chase higher-beta stocks, and get a little more aggressive.
In other words, classic bull market conditions.
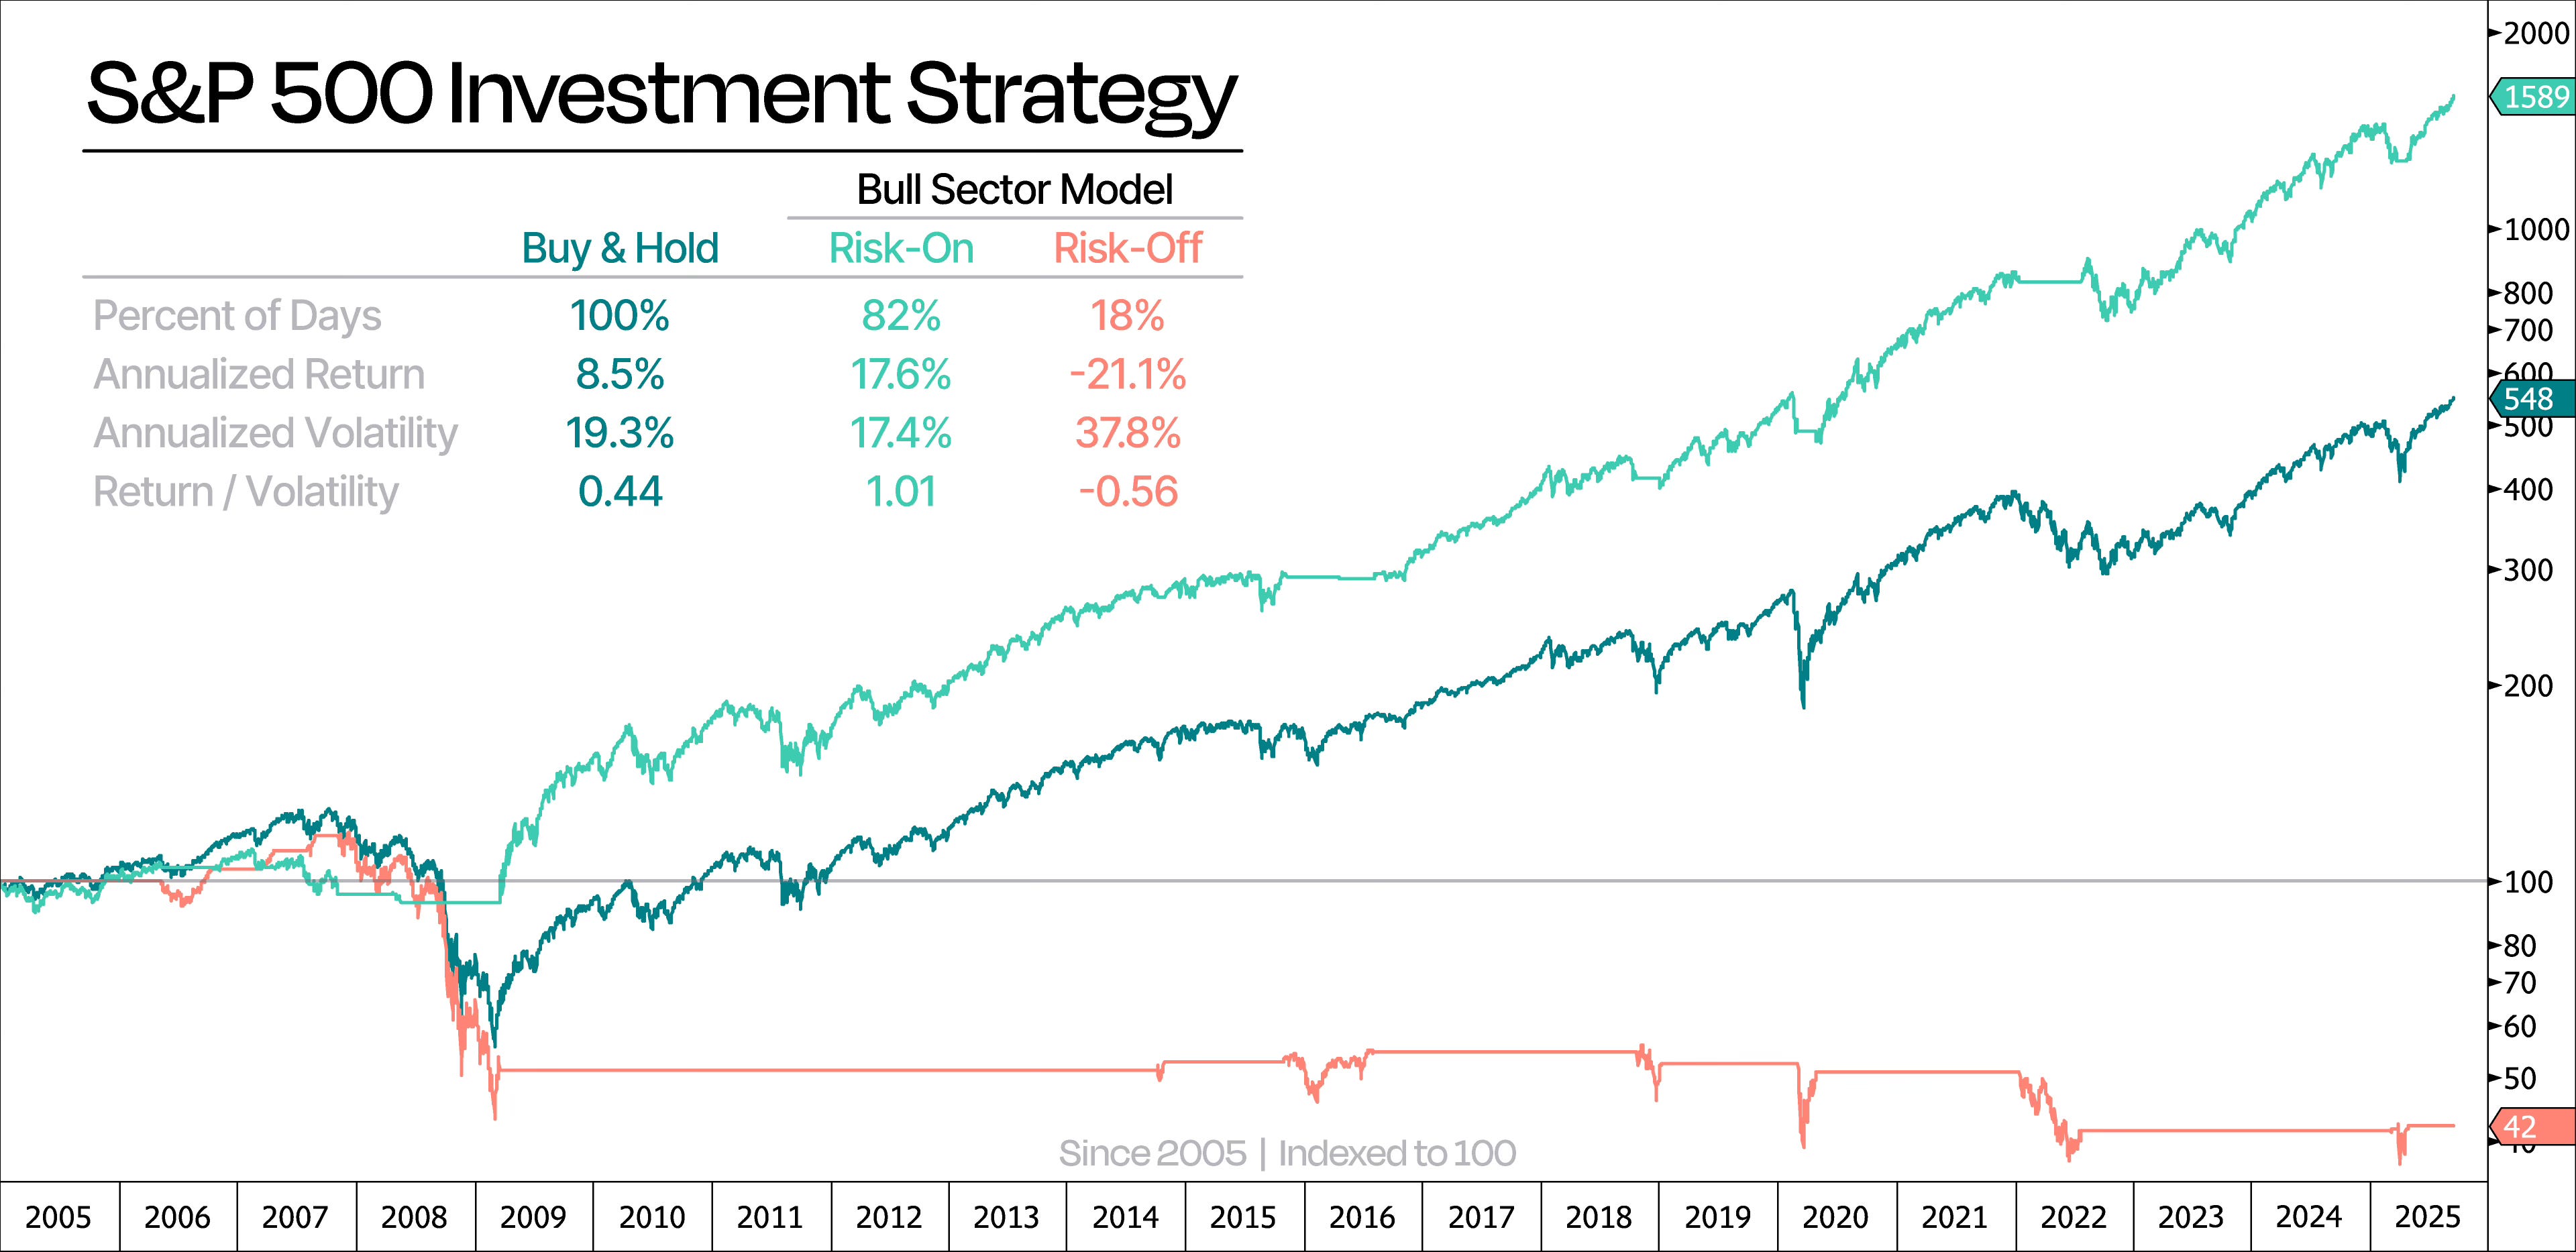
To avoid overfitting or selection bias, we designed a portfolio that focuses on the sectors that historically perform well in bull markets, namely growth and cyclical sectors. Our Bull Sector Model includes Technology, Financials, Consumer Discretionary, Industrials, and Communication Services.
We cap-weight the portfolio and rebalance every quarter. And the results speak for themselves: even though the Bull Sector Model only invests during the same risk-on periods as our Main Framework, it not only delivers stronger annualized returns but even slightly better risk-adjusted performance.
We include the Communication Services sector starting in Q4 2018, when companies such as Google, Facebook (Meta), Netflix, and Disney were reclassified from the Technology sector into the newly defined Communication Services bucket. Prior to this 2018 GICS reshuffle, the old Telecommunication Services sector was considered more defensive, with a profile similar to Utilities and Consumer Staples, though slightly more cyclical than those sectors.
To summarize our approach at Duality Research: we always start by figuring out what kind of market environment we’re in using our Proprietary Model and whether it’s a Breadth Thrust Regime. This allows us to differentiate risk-on periods from risk-off phases.
When the market is in a risk-on environment, we position ourselves in the riskier, growthier, and more cyclical parts of the market.
The chart below shows all our strategies side by side, plus a table summarizing the key stats for each.
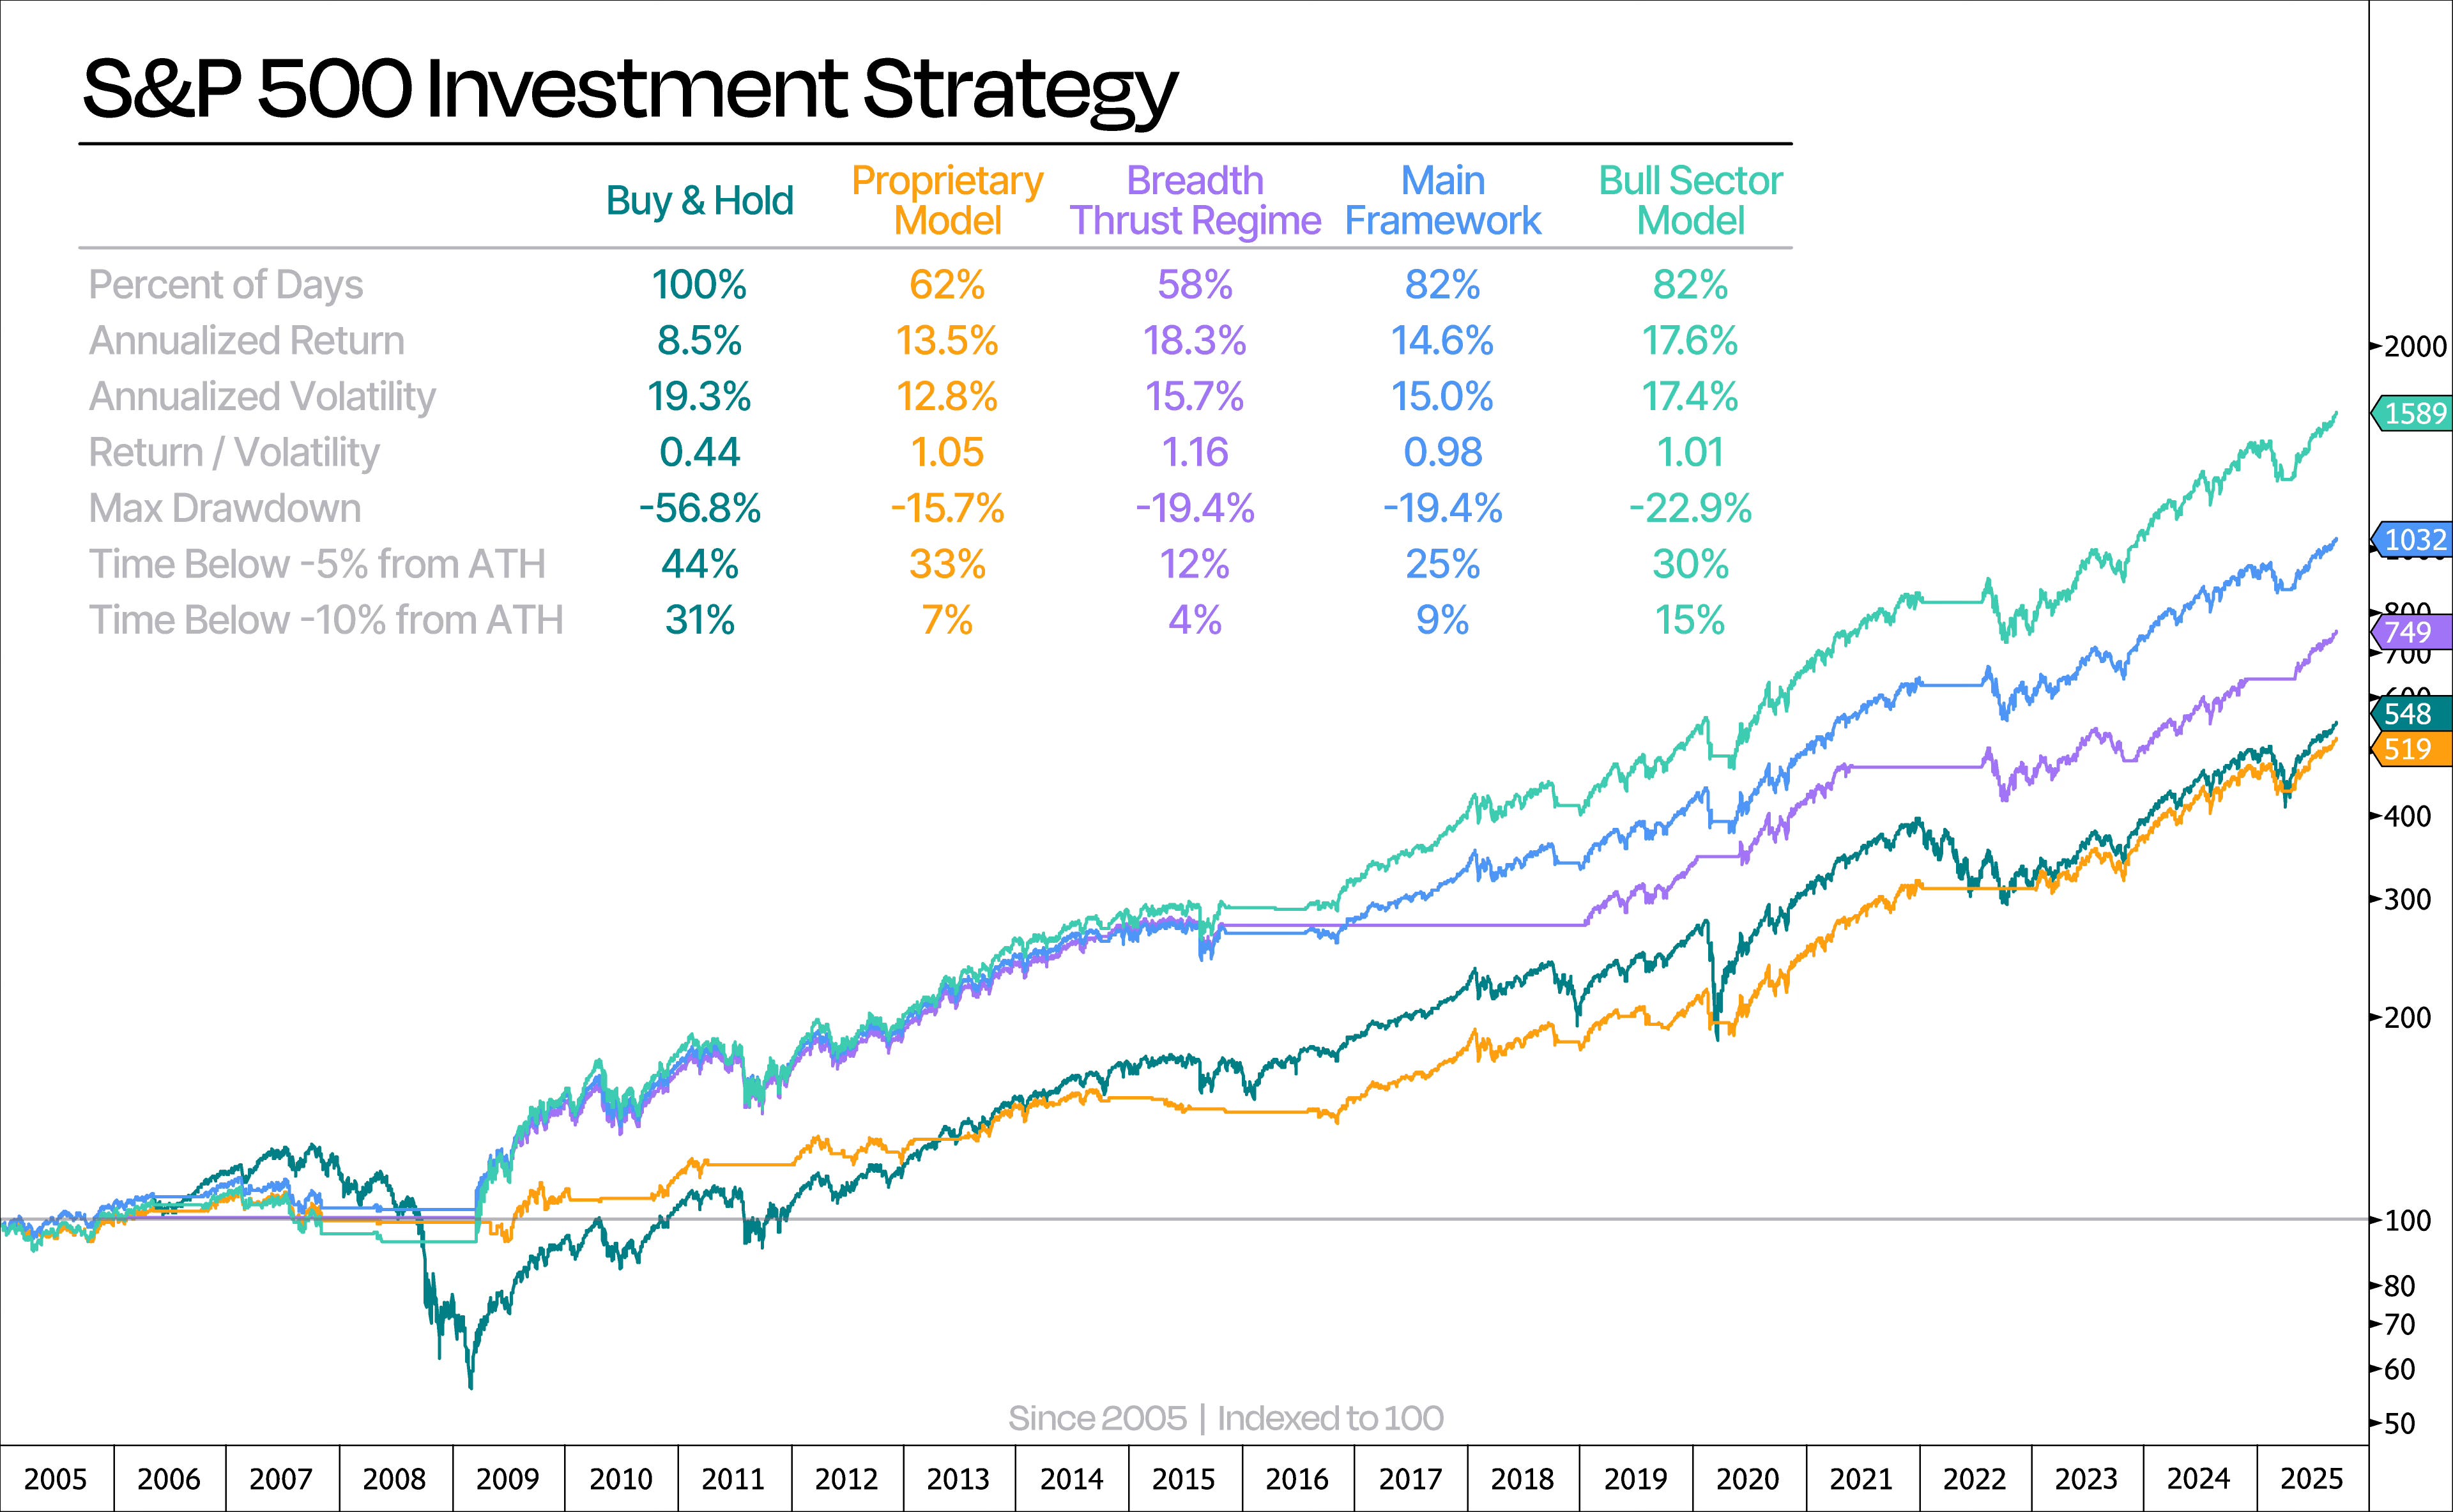
Like we mentioned earlier, our Main Framework isn’t just flashing a risk-on signal — it’s also pointing to the sweet spot of the three stages in our model. This is the phase where we usually see the strongest returns and the best risk-adjusted performance.
The current Breadth Thrust Regime should last until next May, but our Proprietary Model will keep helping us navigate the twists and turns of the market.
Keep reading with a 7-day free trial
Subscribe to Duality Research to keep reading this post and get 7 days of free access to the full post archives.