

Two weeks ago, we said the market was flashing signs of short-term exhaustion. But if anything, that’s usually a sign the bull is still kicking. A week ago, we mentioned that strong uptrends correct over time, not through price. And that’s exactly what we’ve been seeing. The S&P 500 has basically gone nowhere for two weeks.
When the market chops sideways for this long — and in such a narrow range — we like to zoom in and see what’s really going on under the hood. Because even when the surface looks calm, there’s usually something brewing underneath — good or bad.
In this case, it’s mostly positive. Since the July 4th weekend, we’ve seen risk-on areas leading the way:
Tech, Industrials, Discretionary, small-caps, high-beta stocks, speculative growth names, and especially crypto have outperformed the index.
Meanwhile, the more defensive stuff — Health Care, Utilities, Staples, Energy, high-dividend stocks, and low-vol names — has been lagging.
That’s a great sign. Even more so considering that rate cut expectations actually dropped during that stretch.
Another thing helping the market cool off without cracking is that the 5-day average put/call ratio has moved off its lows, while active managers have continued to deleverage.
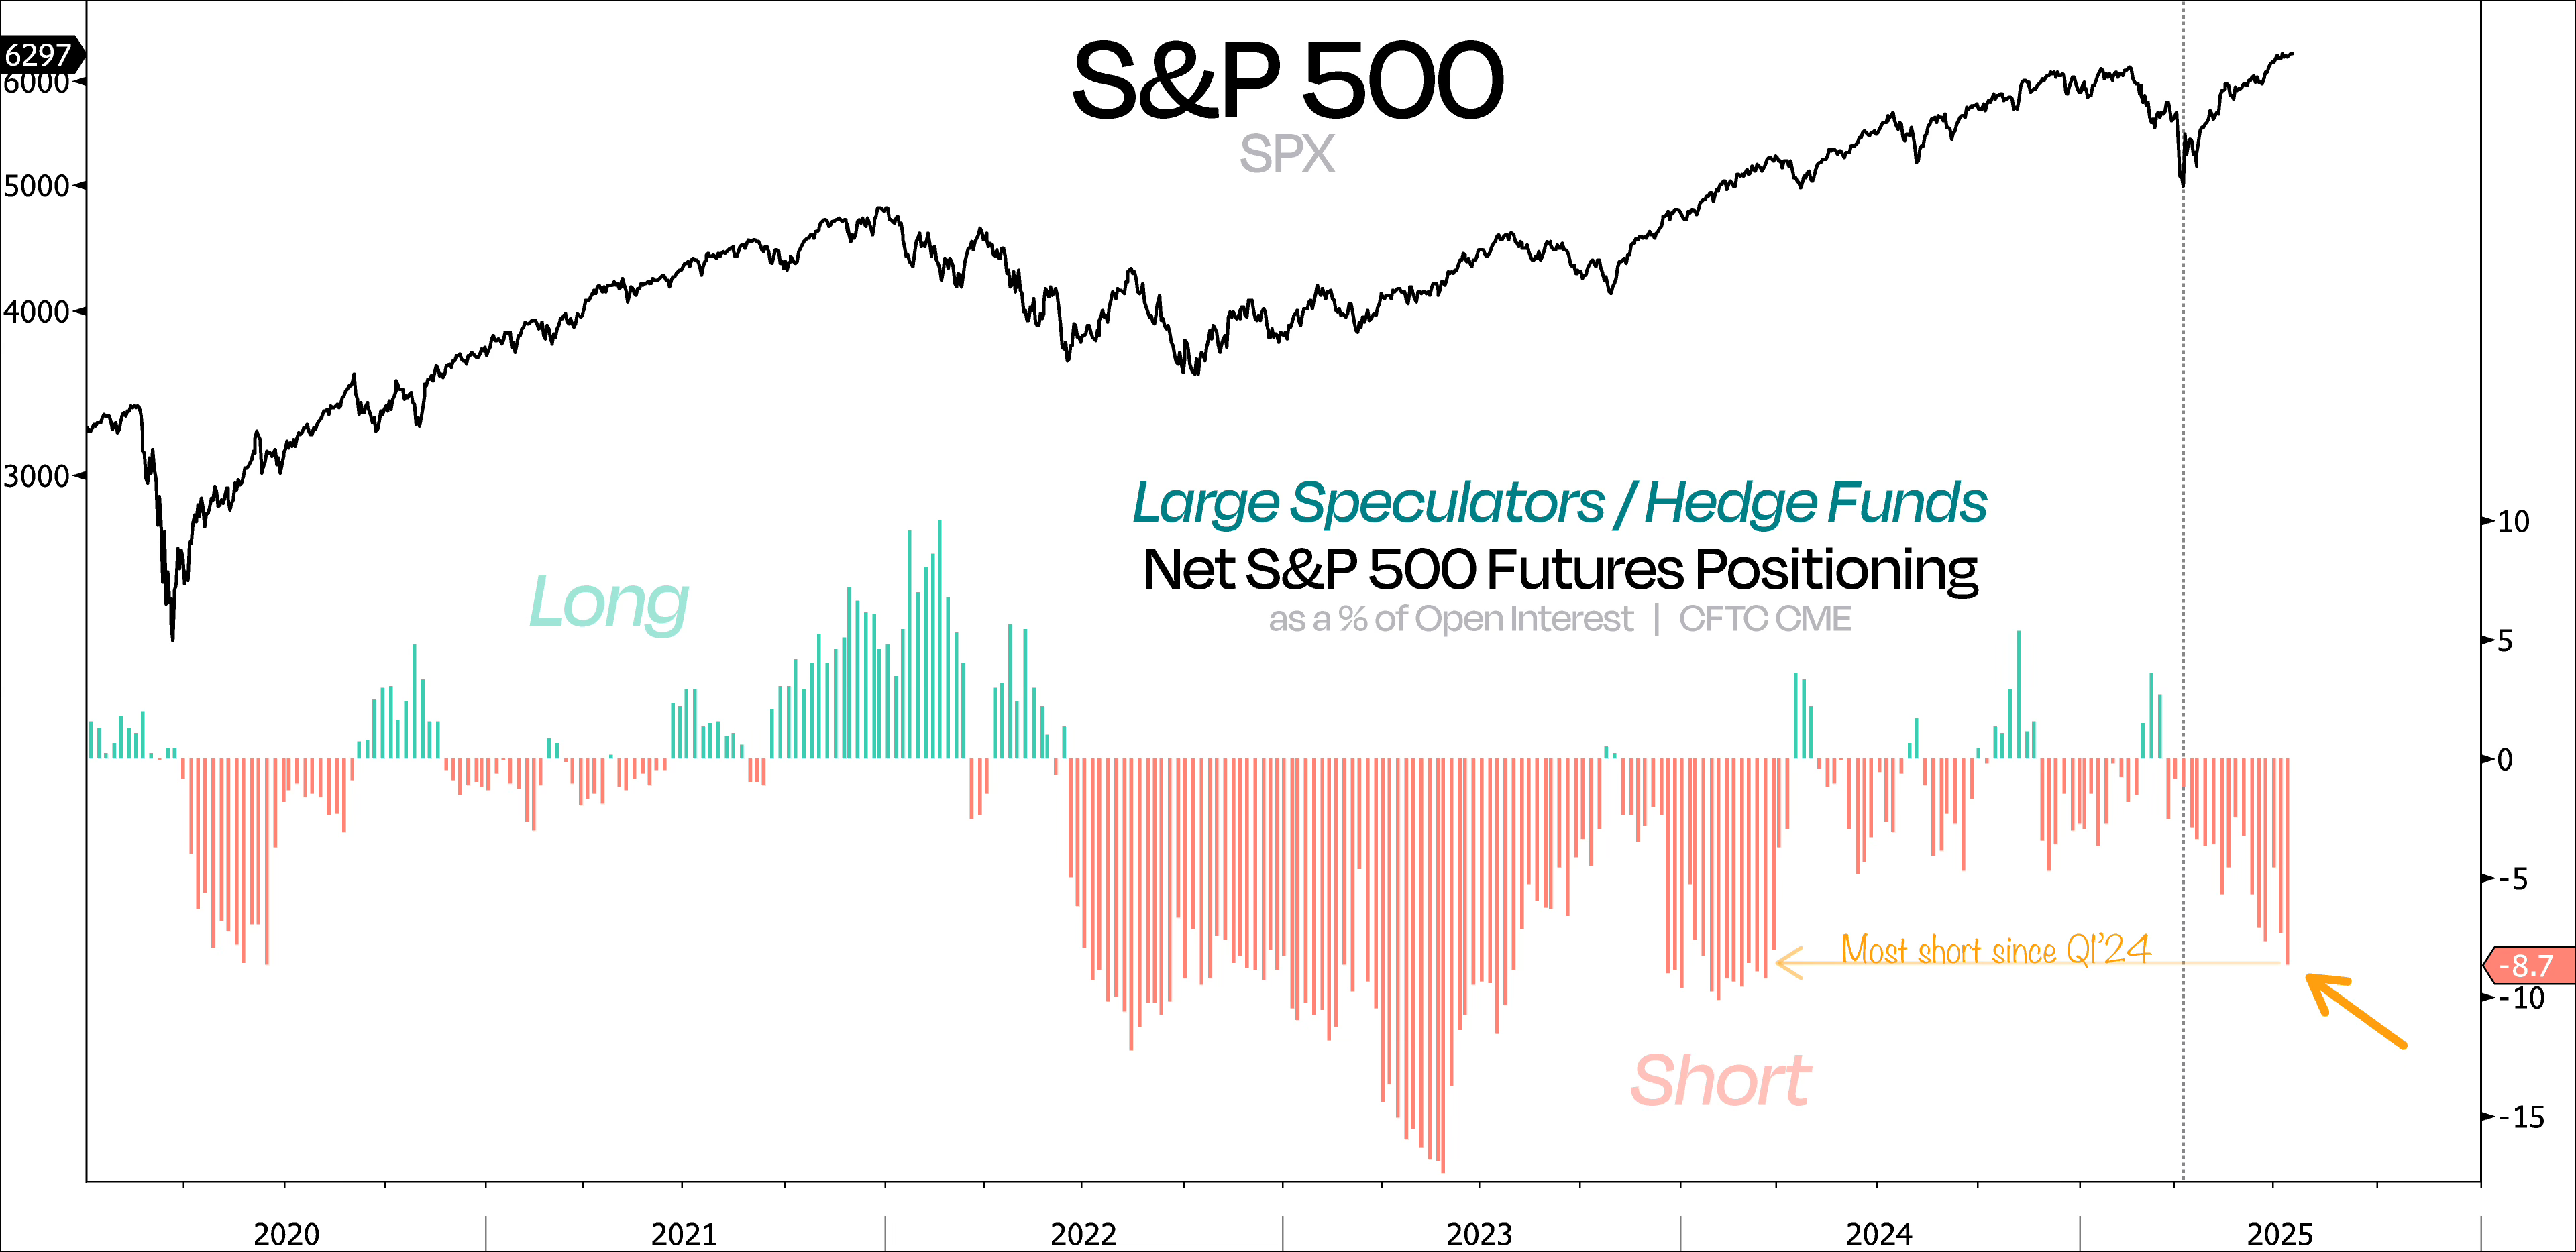
But perhaps more importantly, hedge funds have added to their short positions for a second consecutive week and are now the most net short since the market bottomed in early April.
This tells us the rally is finally facing some pushback again, as a broader base of market participants is willing to fight it. And that’s exactly what we want to see for a stronger, more sustainable move higher.
Even with big institutions dialing back their exposure, this market is starting to catch a solid tailwind from earnings season — perfect for those hot summer days.
Like we said last time, all eyes are now on Q2 — and with the bar set low, it’s setting up nicely for upside surprises.
So far, it’s playing out just as expected: after estimate cuts in April and May, plus easier financial conditions and a weaker dollar, earnings are coming in hot. Out of 58 companies that have reported so far, 50 have beaten estimates — that’s an 86% beat rate with an aggregate earnings surprise of 7.8%. Not bad at all.
Now, when you put that together with strong leadership in the market, steady selling from the big players, and these solid earnings beats, we think the odds of a near-term pullback have come down quite a bit. And with another 250 S&P 500 companies set to report this month, and assuming the trend holds, the “pain trade” could be higher from here.
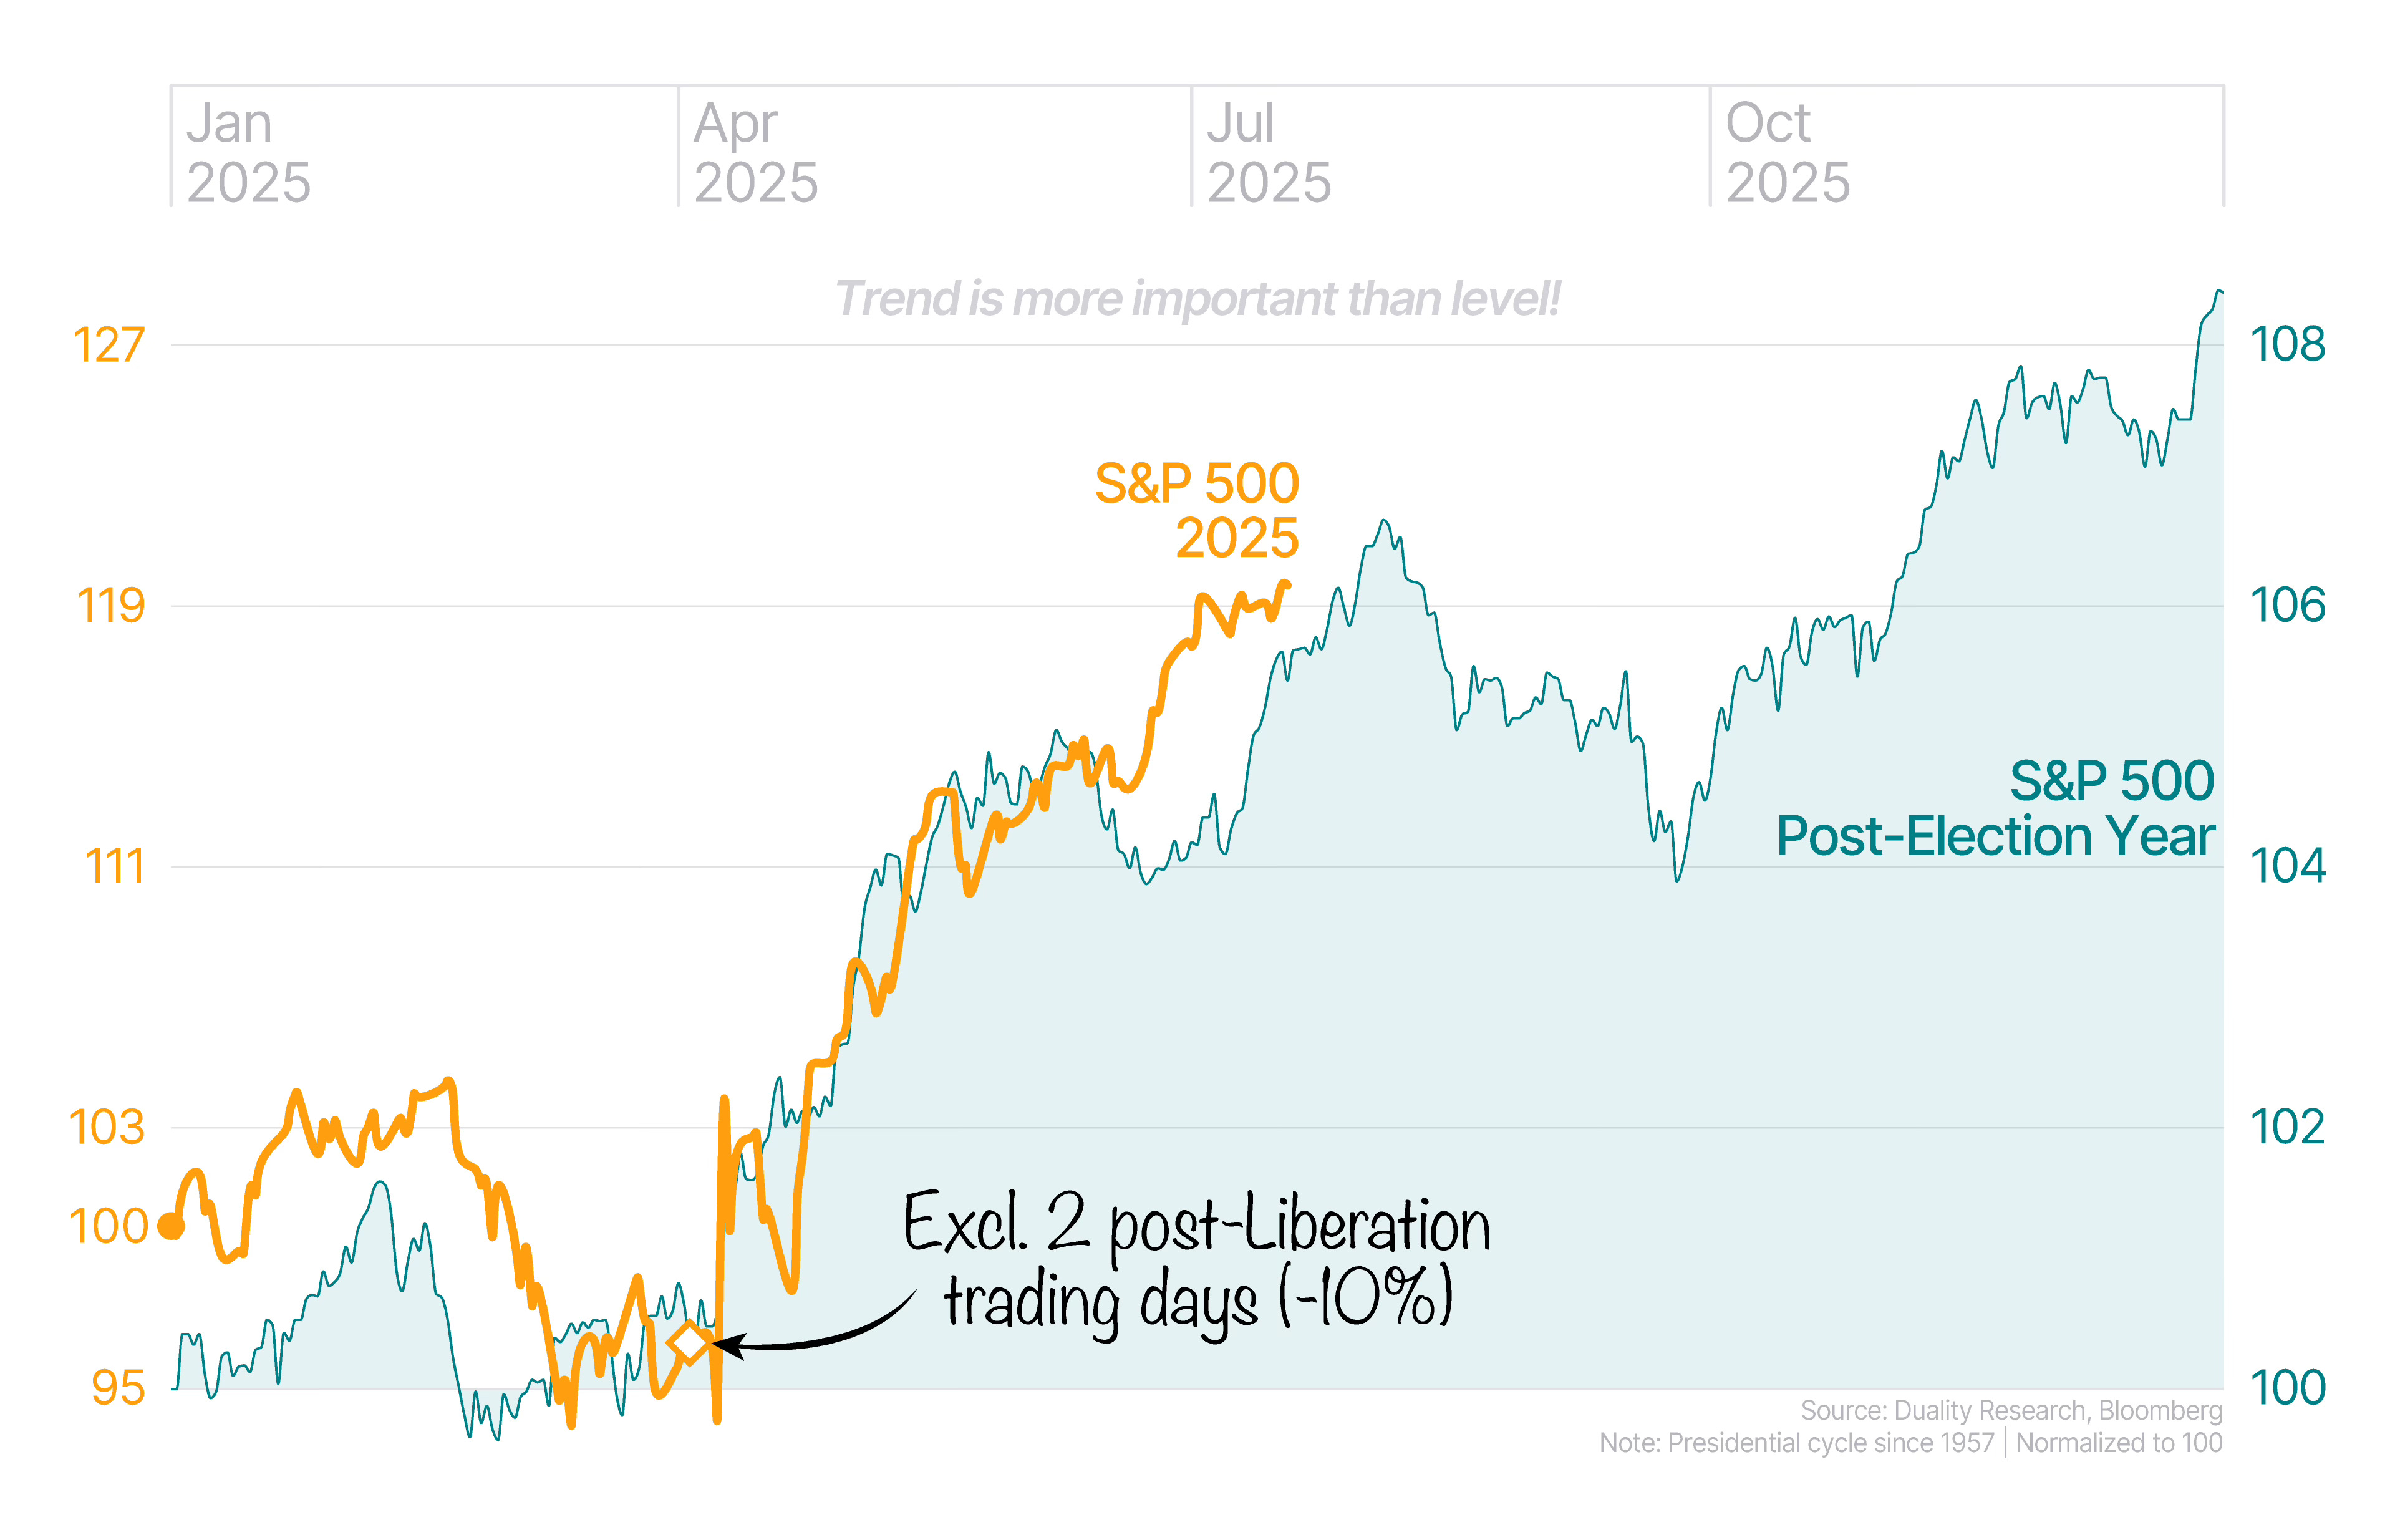
From a seasonality perspective, that wouldn’t be out of the norm too, as the market tends to drift higher into August before a near-term peak.
In fact, if you strip out the two post–Liberation Day sessions where the market lost 10% (just for the sake of this exercise), it becomes clear that 2025 has largely followed the typical post-election script.
So, from a seasonal standpoint, a slow grind higher into August followed by a short-term peak wouldn’t be surprising, with the next leg higher likely starting just before Q4.
That said, don’t expect much action over the next couple of summer months. Markets might stay flat while everyone’s off at the beach, soaking up the sun and enjoying some well-deserved downtime.
But looking out over the next 6–12 months, we still see plenty of upside ahead.
In our recent post, A Landscape Reshaped by New Upside Drivers, we broke down why things have been looking a lot healthier since the market reset three months ago. And just last week, we highlighted that — despite new highs — we’re still a long way from the hallmarks of a fully priced market.
One of the most compelling reasons remains positioning, which continues to hover just below neutral. (see Goldman Sachs & Deutsche Bank)
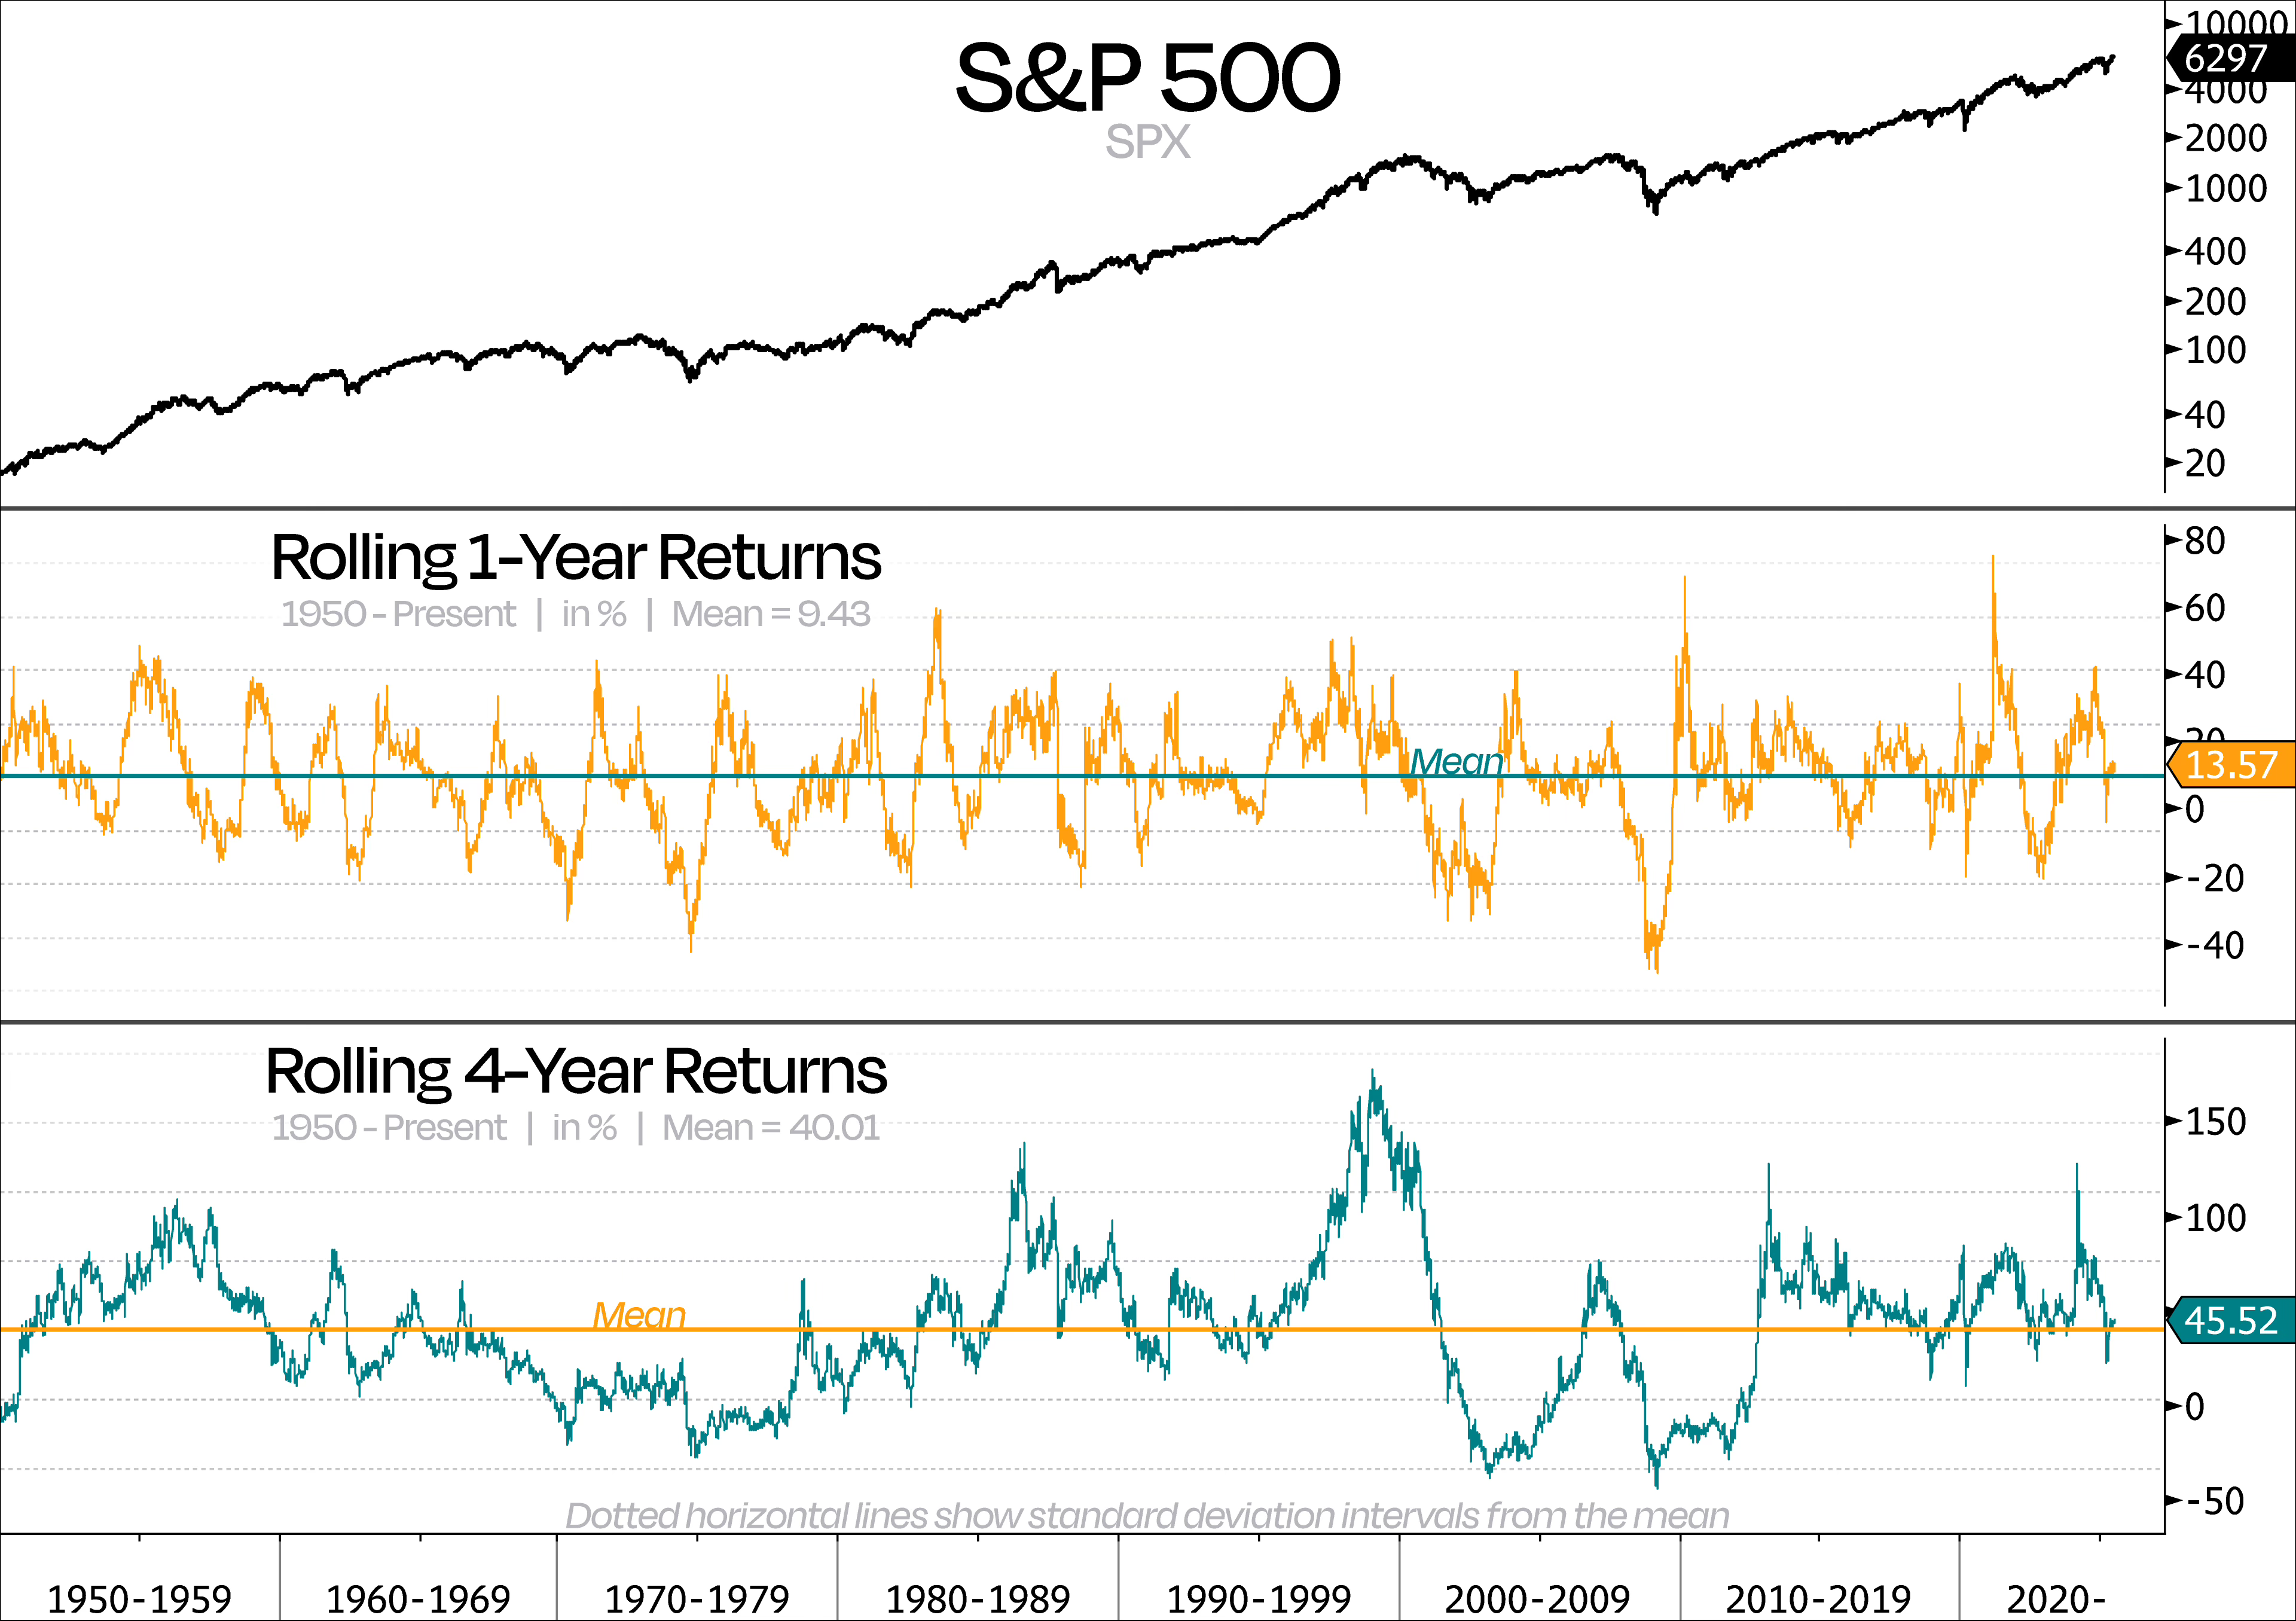
But another way to check whether things are getting stretched is by looking at rolling returns. It gives us a feel for whether price is overextended and if a pullback might be coming.
We usually start with 1-year rolling returns since that’s how most people tend to view markets. But to really understand the bigger picture, we also like to zoom out to a 4-year rate of change. Why 4 years? Because since 1950, the S&P 500 has been up 3 out of every 4 years — and the past 4 years have played out exactly that way.
Right now, the 1-year trailing return for the S&P is sitting right around its long-term average of 9.4%. So no, this market isn’t stretched. Back in April, returns were nearly 1 standard deviation below the average. And in late October, they briefly spiked to 2 standard deviations above — so we’ve seen both ends of the spectrum recently.
Maybe the most surprising stat: the S&P is only up 45% over the past 4 years. That’s just a touch above its historical 4-year average of 40%. So, despite some big swings along the way, returns have settled into a pretty normal range. No signs of excess here — just a market getting back into rhythm.
We ran the same thing for the Nasdaq 100 as well. But because the index hasn’t been around as long — and the Dotcom bubble really skews the early data — we’re focusing on stats from 2005 onward.
Keep reading with a 7-day free trial
Subscribe to Duality Research to keep reading this post and get 7 days of free access to the full post archives.