
Seasonal Scare, Structural Strength
Thoughts on the Market

We saw a couple of eye-catching reversal days last week on some good news — and they definitely got investors’ attention. Some might even say they showed up right on cue, especially with all the talk about seasonality risks and bumpier markets ahead.
Stocks have indeed looked stretched lately, with the S&P 500 spending much of July in overbought territory. And those seasonal warnings aren’t just noise — August and September have a track record of being weaker, especially in post-election years.
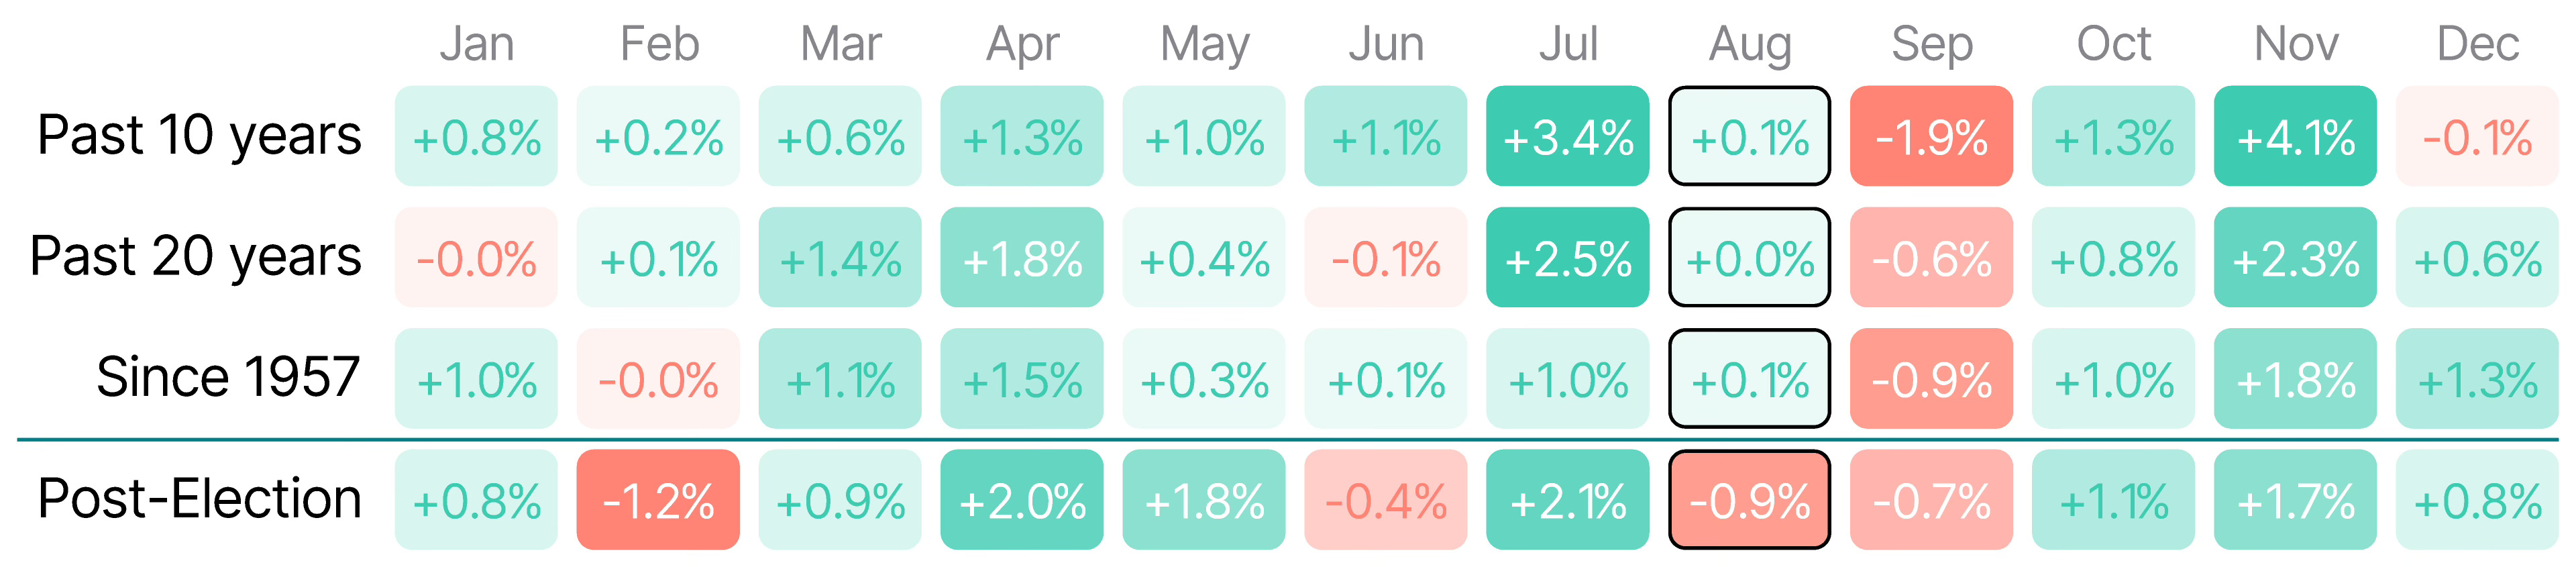
A couple weeks back, we mentioned that from a seasonal point of view, “a slow grind higher into August followed by a short-term peak wouldn’t be surprising, with the next leg higher likely starting just before Q4.”
But what’s surprising us now is how many people are once again expecting a major pullback in stocks.
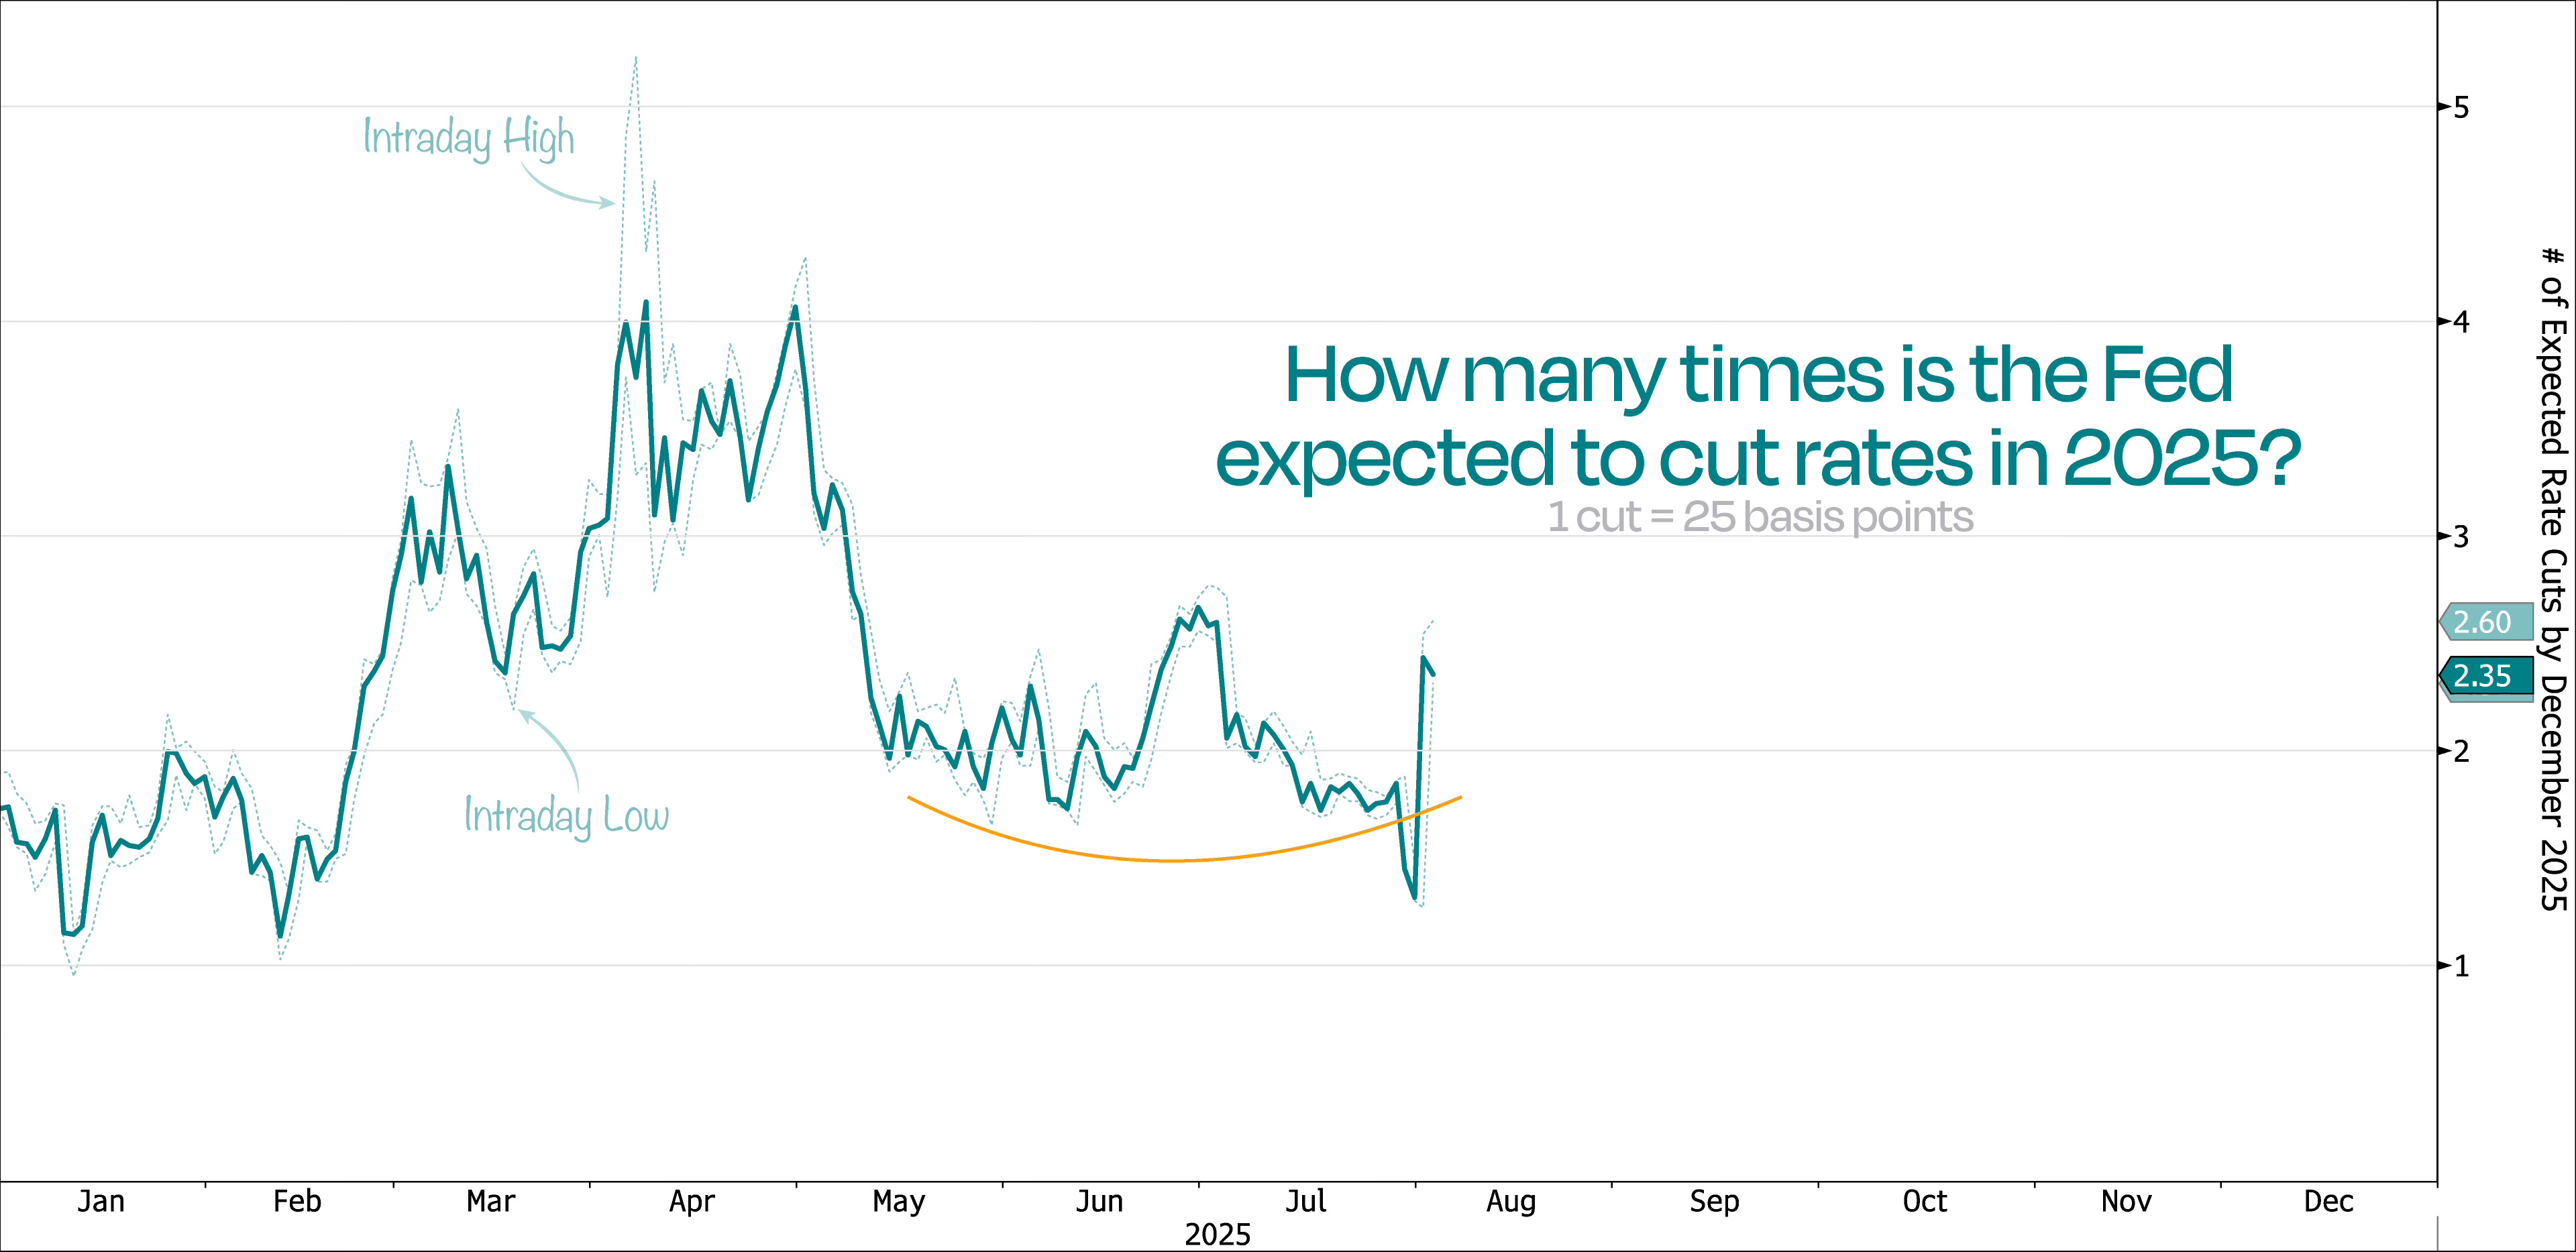
Sure, last week’s FOMC meeting probably helped fuel that feeling. And we’re not about to downplay Powell’s no-change stance — especially since this market still needs to expect a fair amount of rate cuts to stay in that soft landing zone.
Fortunately, though, the rough NFP revisions pushed the expected number of rate cuts for 2025 back above two.
That said, we think it’s worth pointing out that the Fed’s main worry — the labor market — has actually started to stabilize lately.
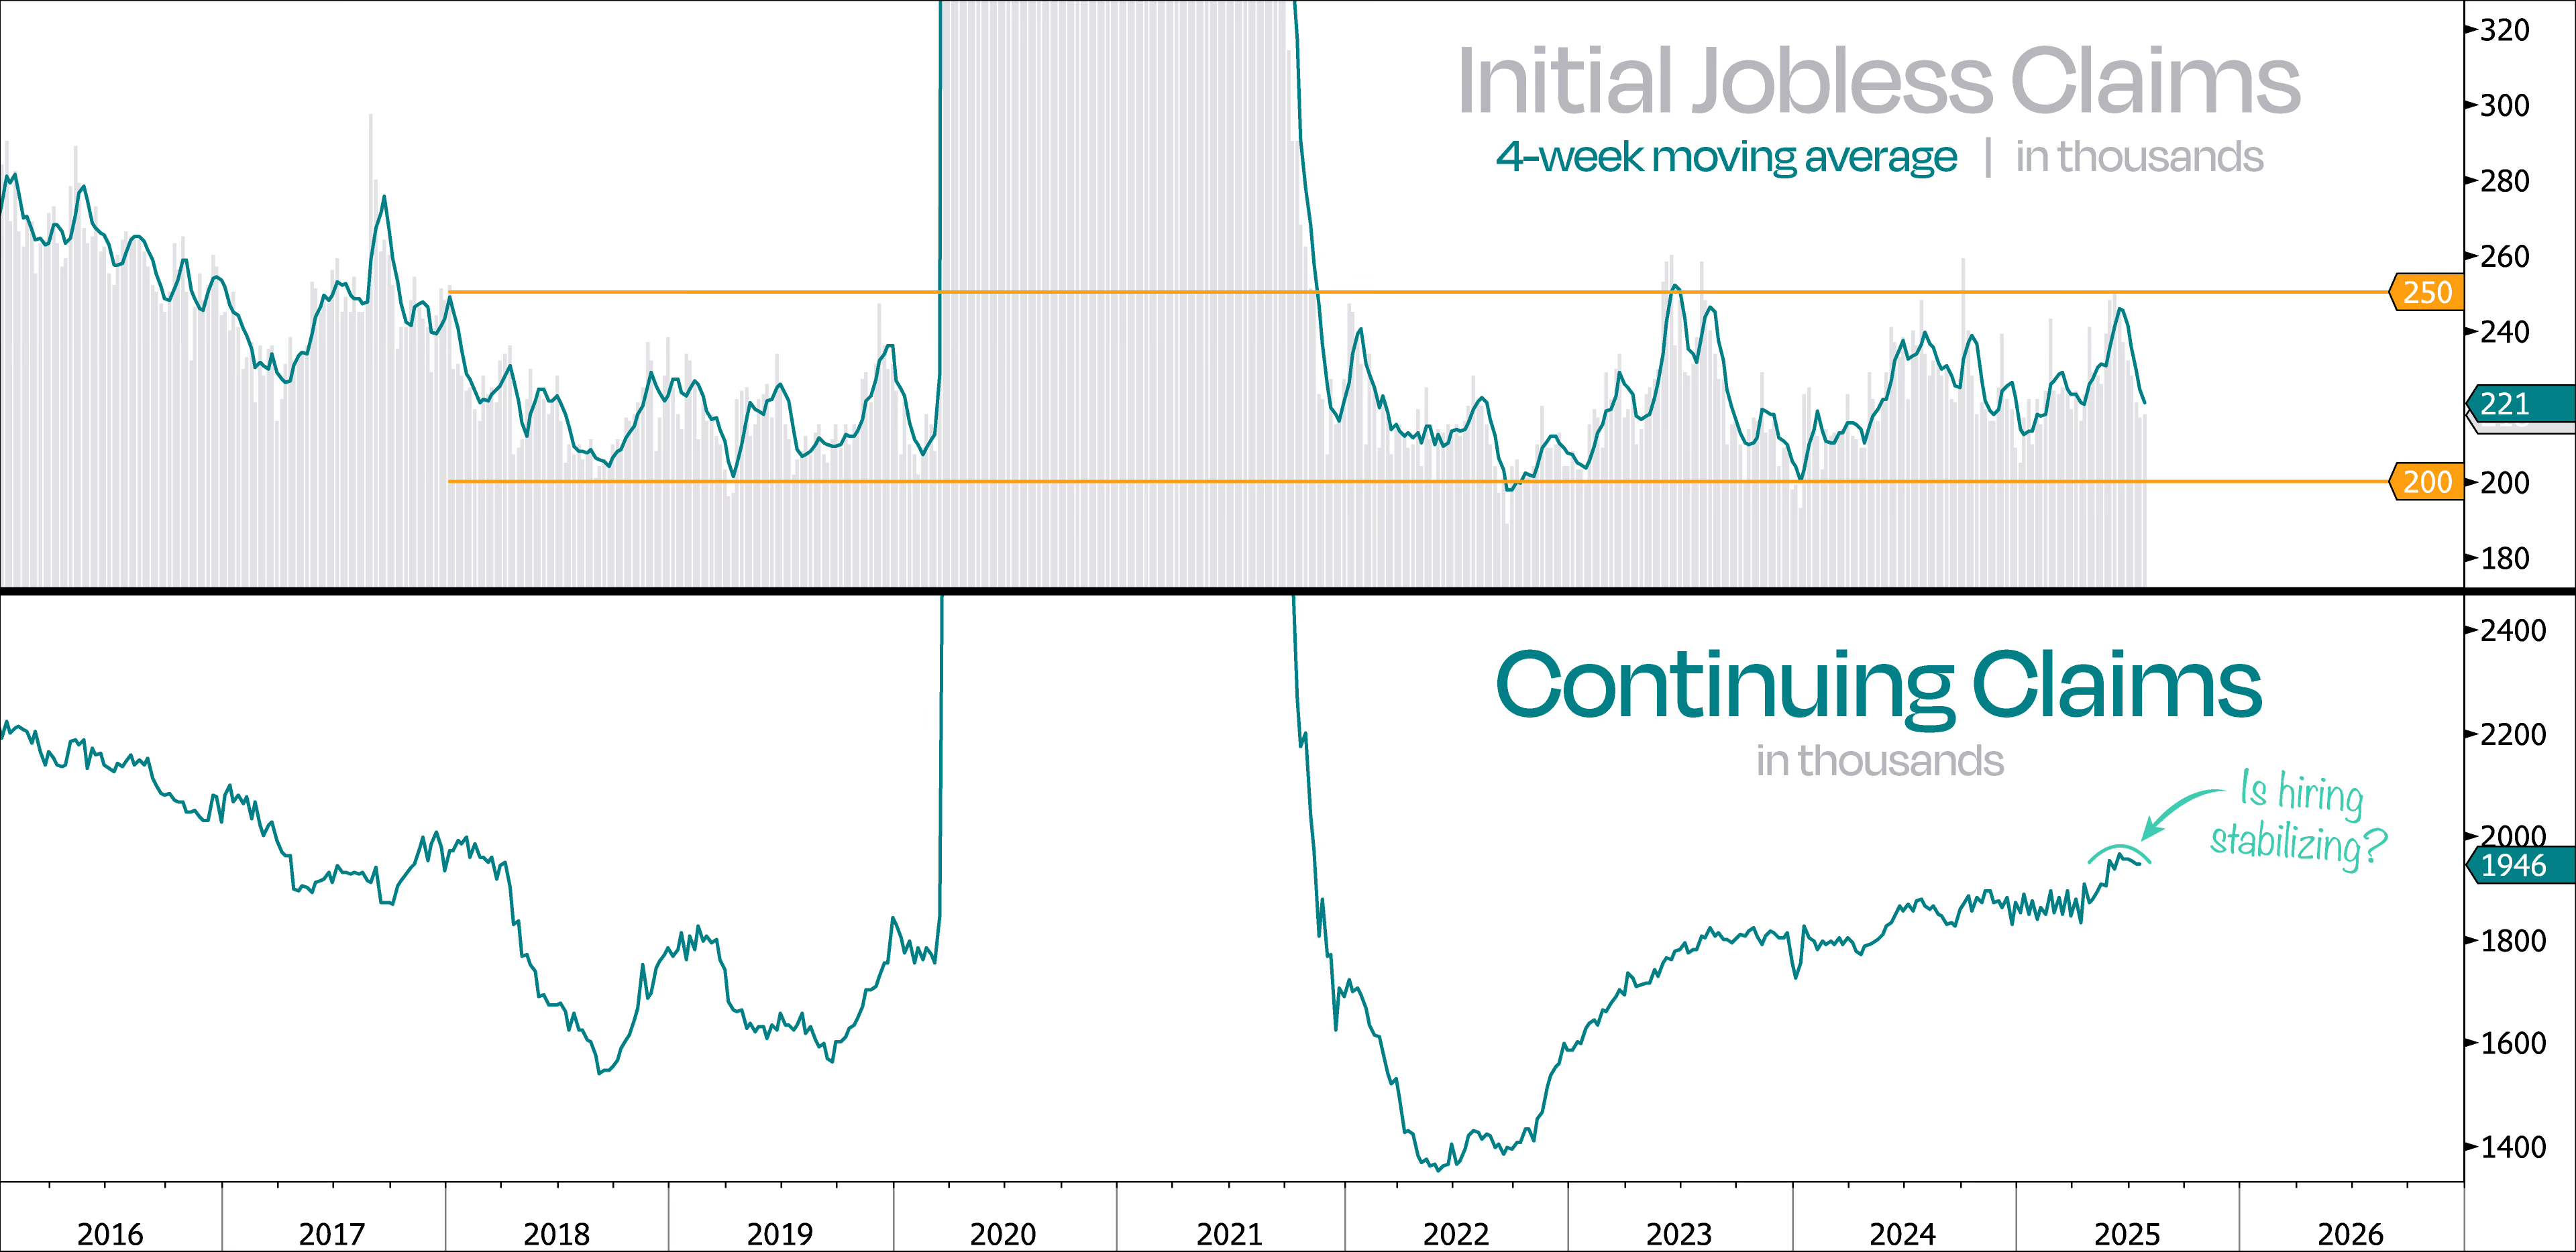
We’re not talking about the lagging Nonfarm Payrolls (NFPs), which are only now starting to reflect the slowdown we’ve been seeing in weekly data for a while.
Instead, looking at weekly Jobless Claims, which give a more real-time view of employment trends, it’s safe to say that layoffs aren’t picking up. In fact, initial claims are still cruising in that healthy 200k–250k range.
Perhaps more significantly, Continuing Claims have backed off their multi-year highs, suggesting that hiring may have stopped cooling off.
Our takeaway: last week’s ugly NFP revisions opens the door for a series of rate cuts. At the same time, weekly real-time data shows the labor market is cooling off, but not falling apart — which should be good news for corporate earnings.
Last Friday's massive downward revisions to NFPs for both May and June finally align with what Continuing Claims have been showing us in real-time over the past two months.
So, while Q2 earnings are coming in nearly 10% higher than last year, we find it hard to see why stocks should take a big hit just because the Fed struck a hawkish tone — or because the calendar says it’s time for some chop.
That said, we do think stocks could struggle a bit in the near term. Honestly, we’d welcome it. This market needs to cool off and work through some of these overbought conditions. But from what we’re seeing, any dip should be short and shallow.
Right now, trying to time every little pullback just feels like a waste of energy — especially when the downside looks limited.
If we do see the potential for a deeper correction (10%+), we’ll say it. But most of the time, when markets look shaky without being broken, we’d rather talk about how to take advantage of it — not hide from it.
With that in mind, let’s take a look at why this market isn’t broken — and why any pullback is likely to be pretty mild.
Let’s start with a quick look at how the S&P 500 has moved since Q4 2024 to get a sense of where we stand today.
In the next chart, we’ve shaded the different phases of the market and dropped in the anchored VWAPs we think matter most.
AVWAP (Anchored Volume Weighted Average Price) shows where the average buyer (since a specific event like earnings or a breakout) has entered, based on both price and volume. It tells you whether most participants are in profit or loss, helping identify key sentiment shifts and potential support/resistance zones.
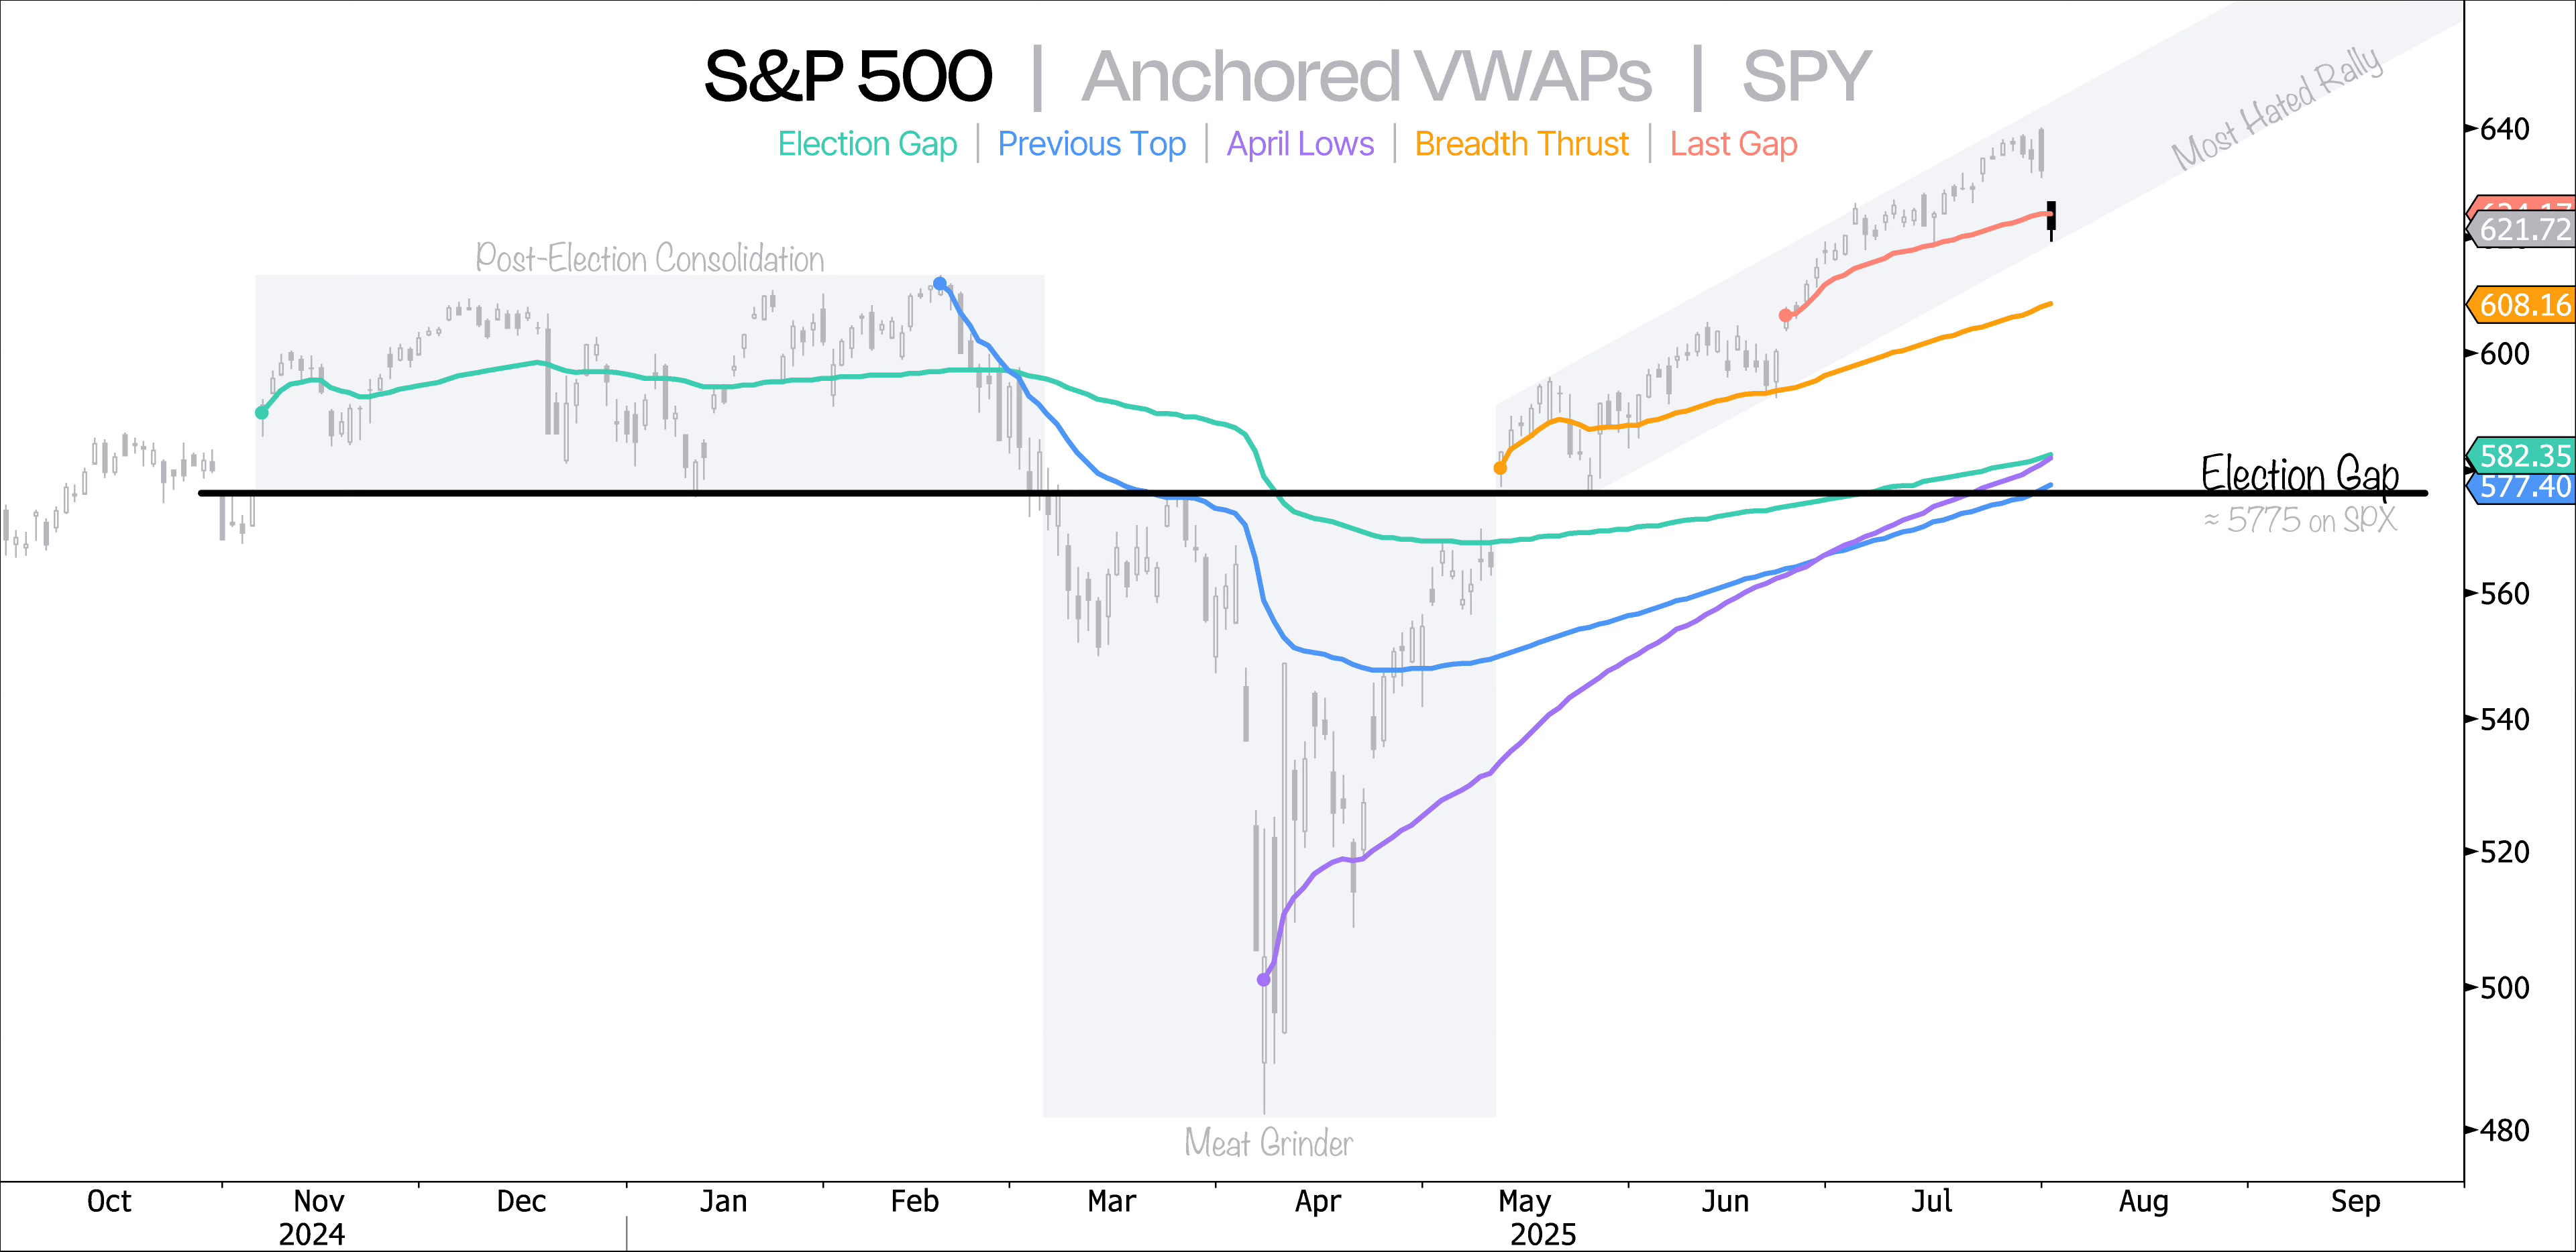
So far, we’re still in the rising channel, and more importantly, holding above most of the key anchored VWAPs.
The one we’re really keeping an eye on right now is the orange VWAP from the May 12 gap. Why? Because that day was a turning point, where the S&P 500:
Gapped above its 200-day moving average,
Left the dreaded “meat grinder” zone in the dust, and
Triggered a deGraaf Breadth Thrust (not something you see every day).
A drop to that level would mean about a 5% pullback from recent highs — nothing major, just a standard, shallow pullback. It also lines up with the 50-day moving average, which adds some technical weight.
Keep reading with a 7-day free trial
Subscribe to Duality Research to keep reading this post and get 7 days of free access to the full post archives.