


The Mix Matters More than Ever
Thoughts on the Market

Last week started off on a strong note, but things got a bit shaky as it went on.
With the market still looking overbought, we’re seeing some profit-taking as investors digest the big move we just had.
On our end, we’re still holding onto the hedges we put on the week before last, right after the VIX popped above its 10-day moving average.
Even though it’s dipped back below since last Monday, we’re holding onto those for now, as we don’t think it’s too heavy a price to pay for continued downside protection after a move this big.
That said, like we mentioned last week, it’s important not to turn overly bearish in the short-term.
After all, there are still plenty of signs pointing to a longer rally in equities:
Institutions and hedge funds remain significantly underexposed equities
We’re in the middle of a Breadth Thrust Regime
And global liquidity is on the rise
Now, pair this with economic data starting to surprise on the upside, and expect pullbacks to get bought.
For the S&P 500, that probably means any dips are unlikely to break below 5700.
In case you missed it, macro data is finally starting to beat expectations again after three straight months of meh prints.
We actually flagged this almost three months ago, as financial conditions were already loosening back then.
Let’s remember that financial conditions impact growth with a delay (usually 2–3 months), so it made sense to expect better data right about now.
You can see this pretty clearly in our first chart: the inverted US 10-year yield tends to lead the Citi Economic Surprise Index by about two months in this case.
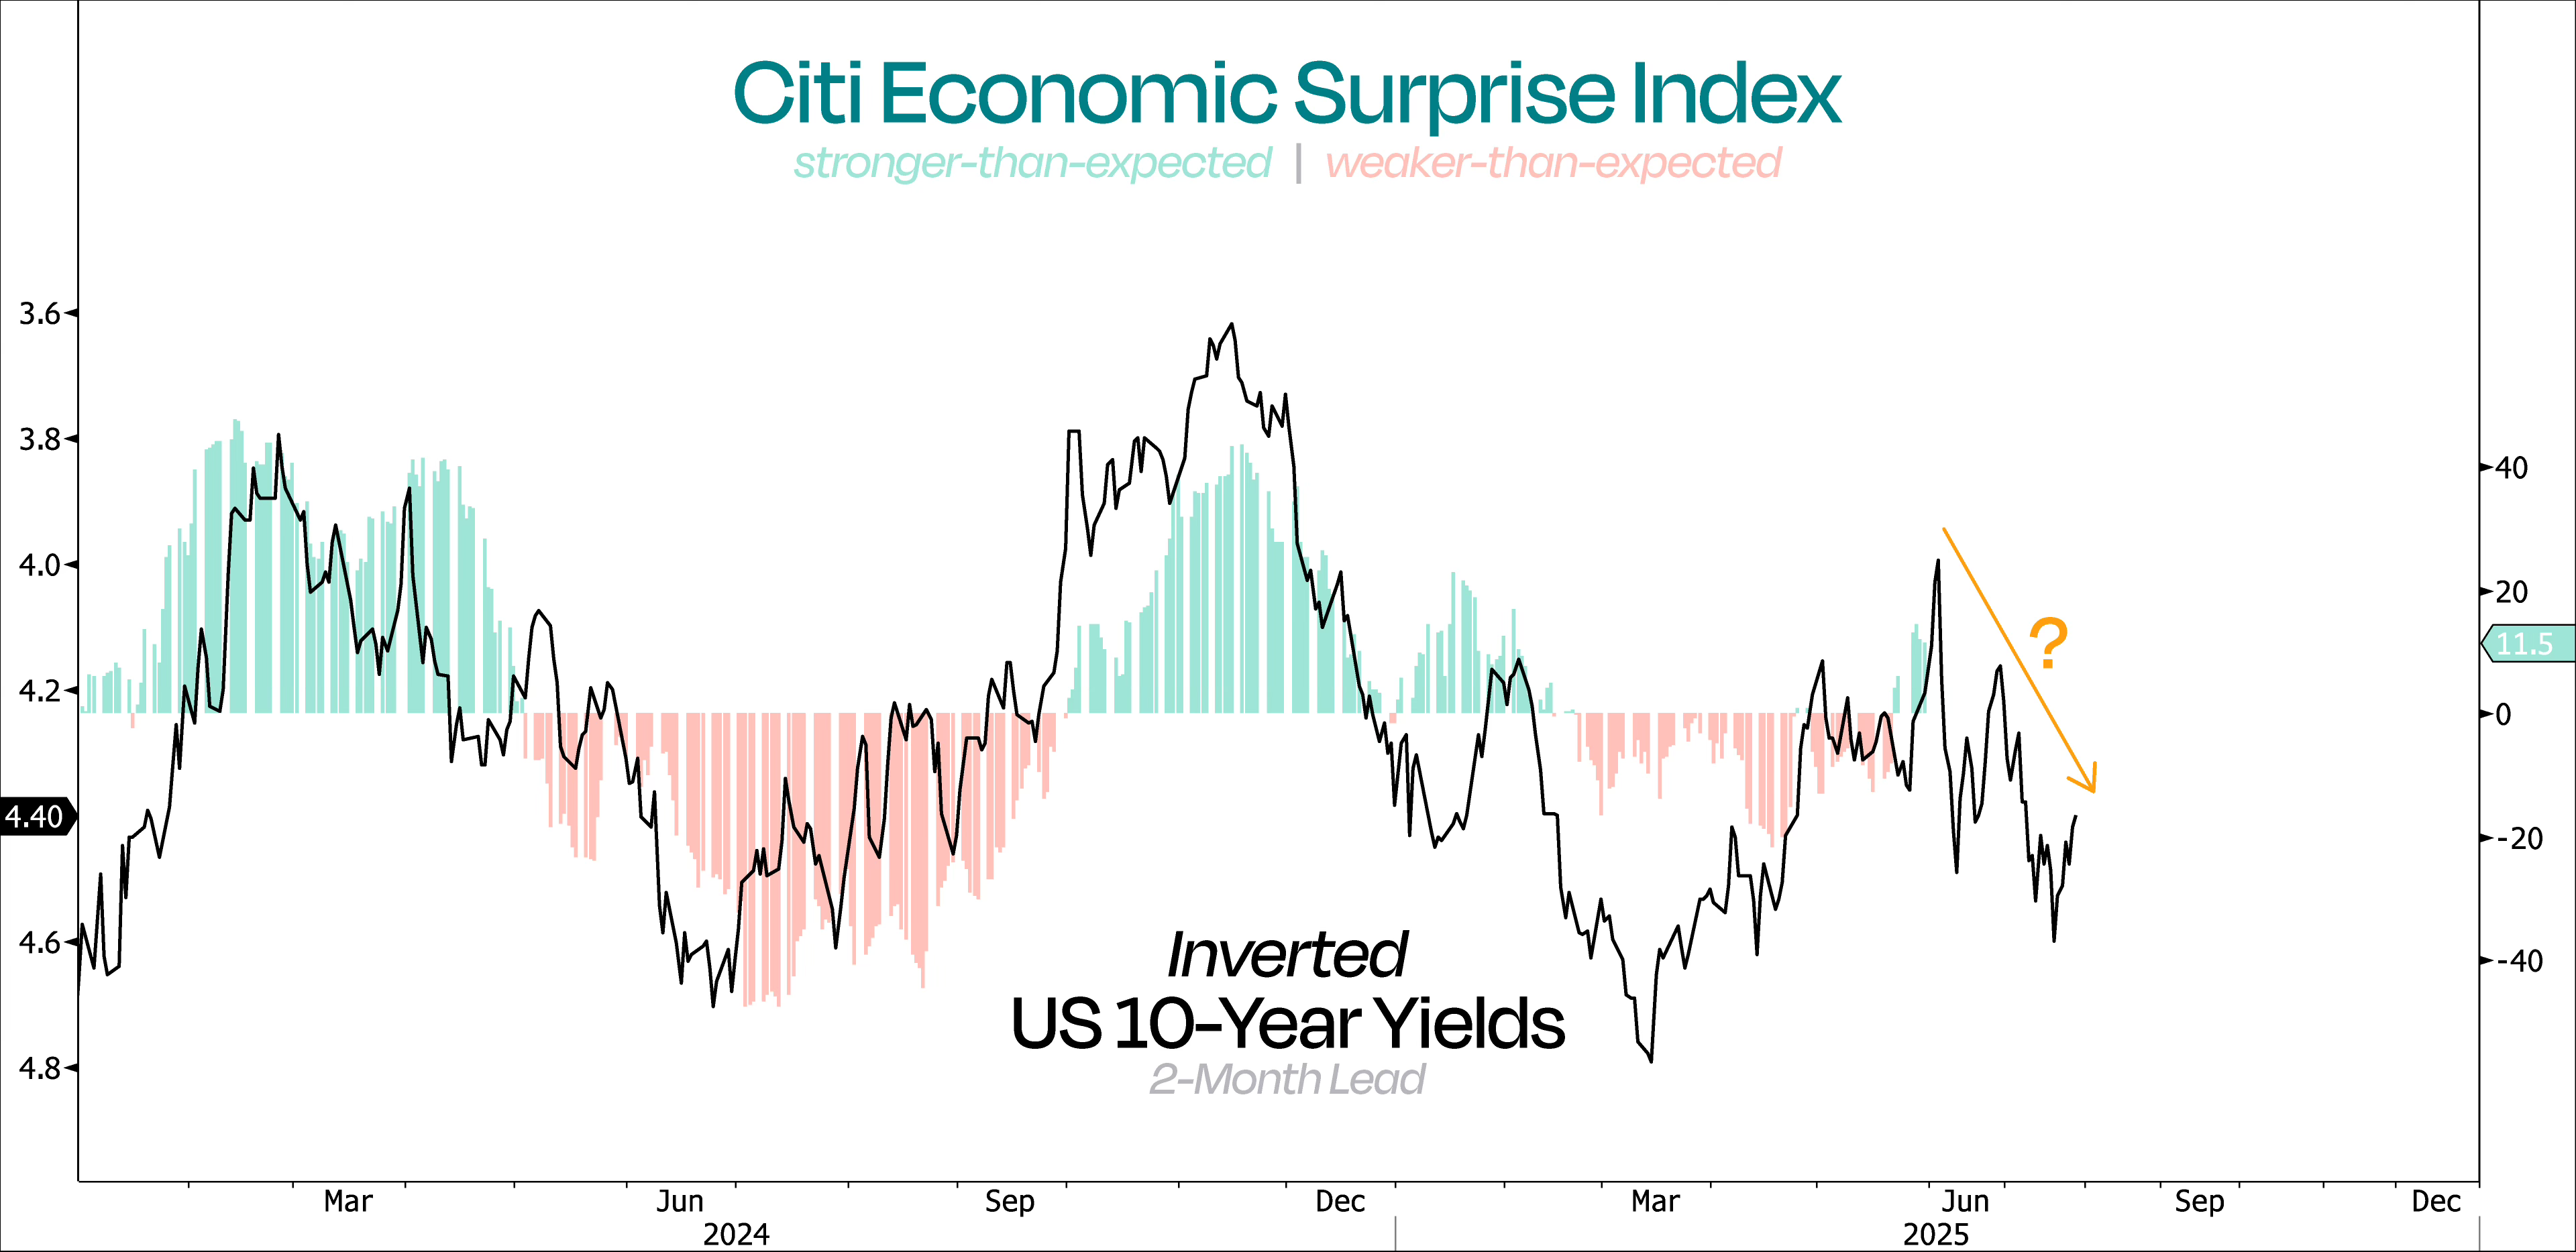
But here’s where it gets tricky. If you just go by that relationship, you might assume that the good news won’t last.
Surprises will turn negative again and stay there into August, right?
Well, not so fast. Financial conditions aren’t just about interest rates.
They’re essentially a function of interest rates, oil prices, and the US dollar.
When we chart all three together, we can clearly see a tight relationship among them.
But more importantly, it shows how the usual tight correlation started breaking down last October.
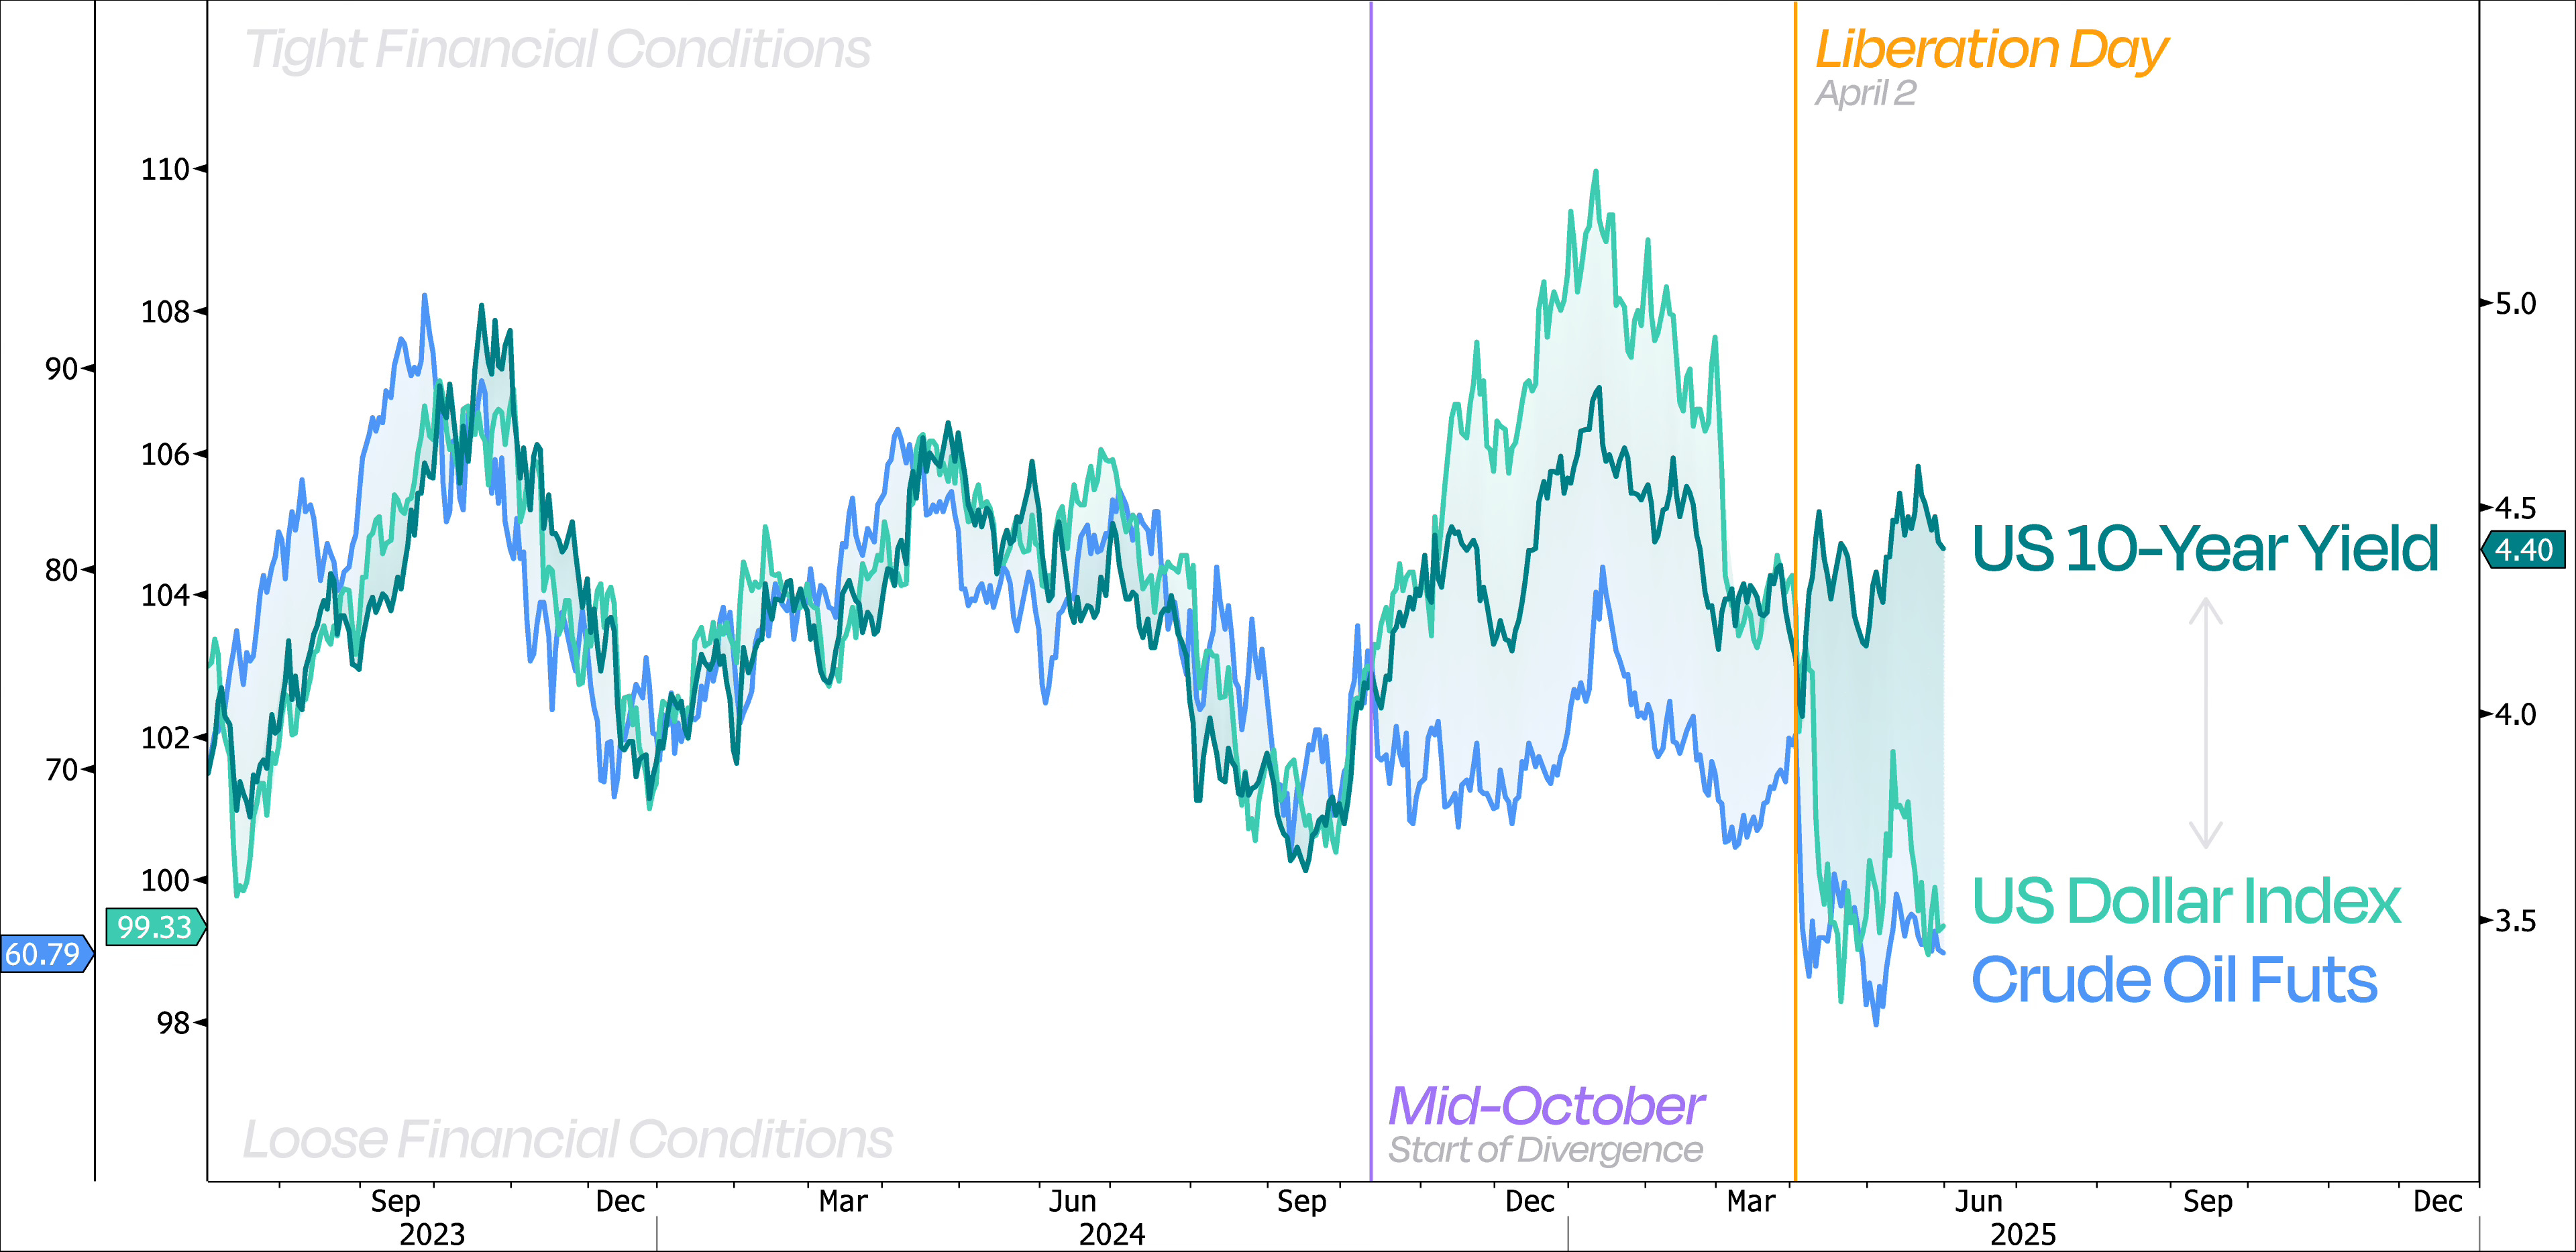
That disconnect may help explain why the Citi Economic Surprise Index didn’t dip more sharply in March and April, despite rising rates.
But what really stands out is the divergence that started on April 2 – Liberation Day.
Normally that would mean tightening conditions – and weaker growth ahead.
This time, however, higher rates haven’t been enough to tighten financial conditions, because the dollar and oil have both dropped hard enough to offset the impact of higher rates.
Bottom line: looking at rates alone doesn’t cut it anymore. The full picture shows that conditions are still loose, and that means economic surprises could keep coming in stronger than expected for a little while longer.
So, once again – when the economy keeps surprising to the upside and liquidity is on the rise, dips will be bought!
Let’s not forget that tons of money managers missed out on that 25% rally in stocks.
Imagine the FOMO if you’ve been sitting on the sidelines while markets ripped higher.
That pain is real – and it’s driving buyers back in.
That said, even though we’re still being a little cautious short-term (hence the small hedge), the real focus should be on finding stuff to buy, not figuring out what to sell.
Tech is stepping back into the spotlight in this rebound – just like it did during the first two years of this bull market.
We wouldn’t be surprised at all if it leads the charge again over the next 3–6 months.
And here’s what’s interesting: Tech actually underperformed the market over the last 12 months. That’s pretty rare. Historically, it beats the S&P 500 about 76% of the time over any given year.
Since 2005, it has outperformed by an average of +6.24 percentage-points on a rolling 1-year basis.
In other words: the S&P usually lags Tech, not the other way around. So the fact that Tech has trailed lately, tells us it might be still oversold on a relative basis.
Take a look at the rolling 12-month relative returns for Technology vs the S&P 500.
When the line is above 0%, Tech is outperforming. Below 0%, it’s lagging. Right now, it’s been below – which could be your setup for a continued bounce.

Like we mentioned before, Tech has been leading the way in this rebound – and that started right around the time its performance vs the S&P 500 hit a pretty extreme low: about 1 standard deviation below its long-term average.
For almost a year, Tech stocks went nowhere. But given the fact that they had essentially doubled since the start of this bull market, that period of consolidation was both expected and constructive.
It’s important to remember that markets can correct either through price or through time – and in this case, the past 12 months of going nowhere served that purpose well.
Even with all that sideways action, Tech is still up +11.6% over the past year. Yet, its forward P/E actually dropped by -5.2%.
So, Tech moved higher, but valuations cooled off. That’s the kind of combo we like to see.
Now, it looks like Tech is finally ready to break out of this year-long downtrend vs the S&P 500. That’s something worth watching.
A breakout here wouldn’t just be good news for Tech – it could send a strong risk-on signal to the whole market, giving this V-shaped recovery even more legs.

Whenever we talk about Tech, it’s hard not to bring up the Magnificent 7 – even though only three of them are actually in the Tech sector.
That said, this group just put up 32% YoY earnings growth in Q1, way ahead of the rest of the S&P 493, which only grew 8%.
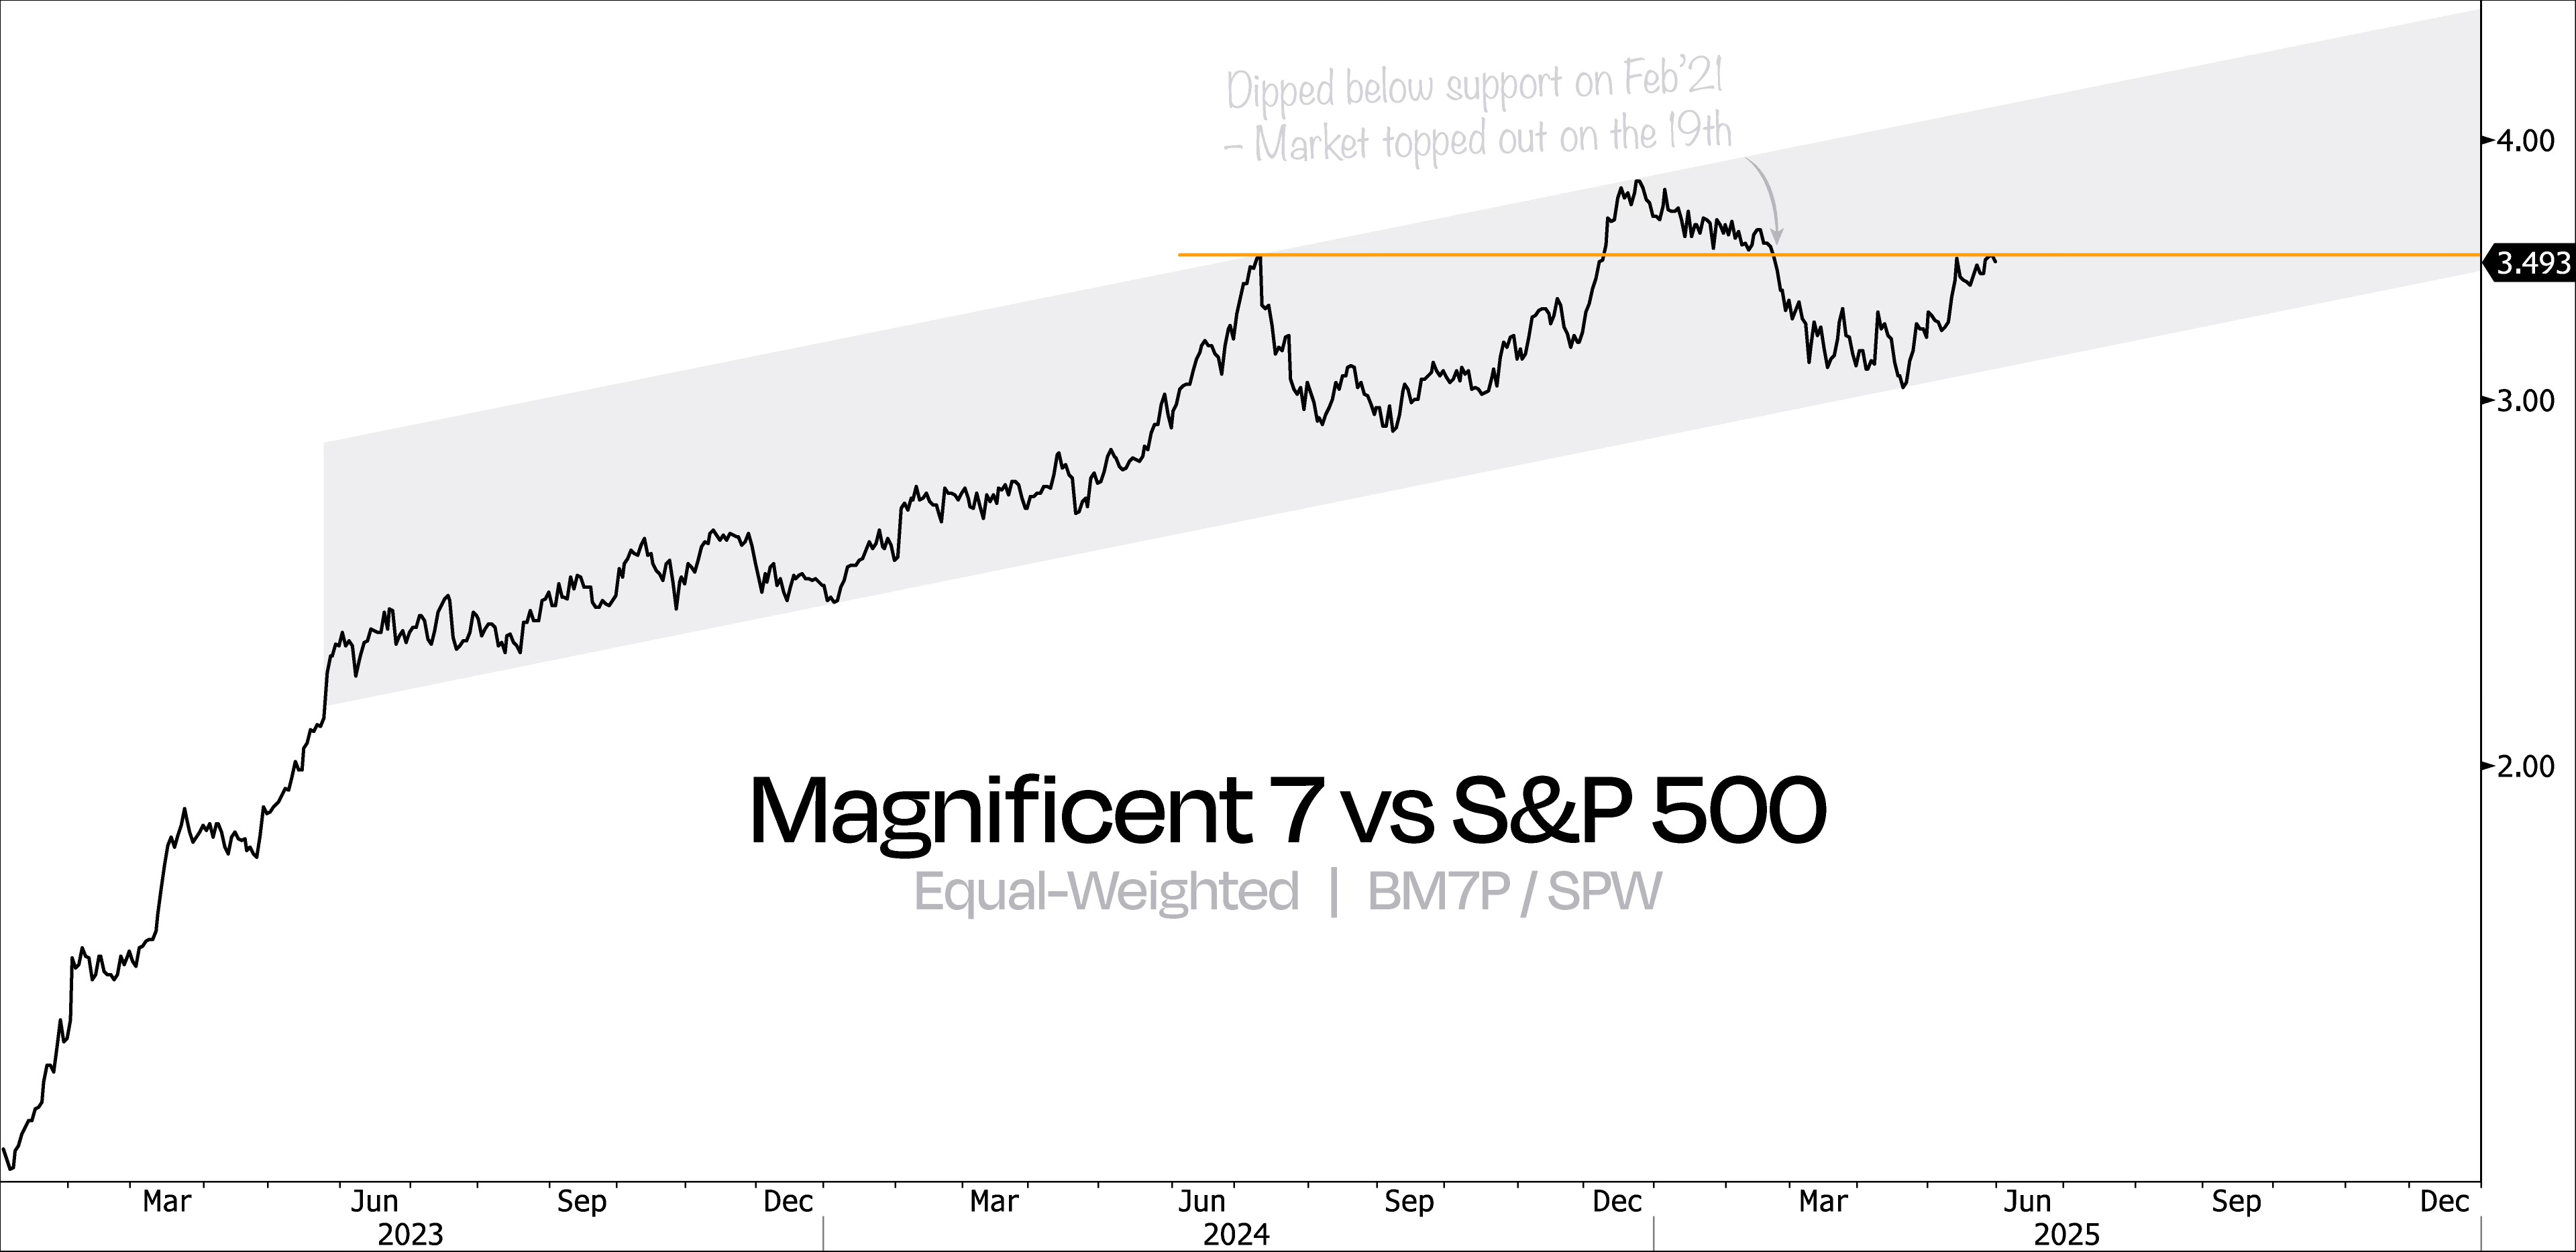
Now, check out the equal-weighted Mag 7 vs the equal-weighted S&P 500 – it’s sitting at a big level.
And once that breaks, don’t be surprised if people start complaining again that it’s “just seven stocks going up” (which, for the record, wasn’t really true in ‘23 or ‘24 either).
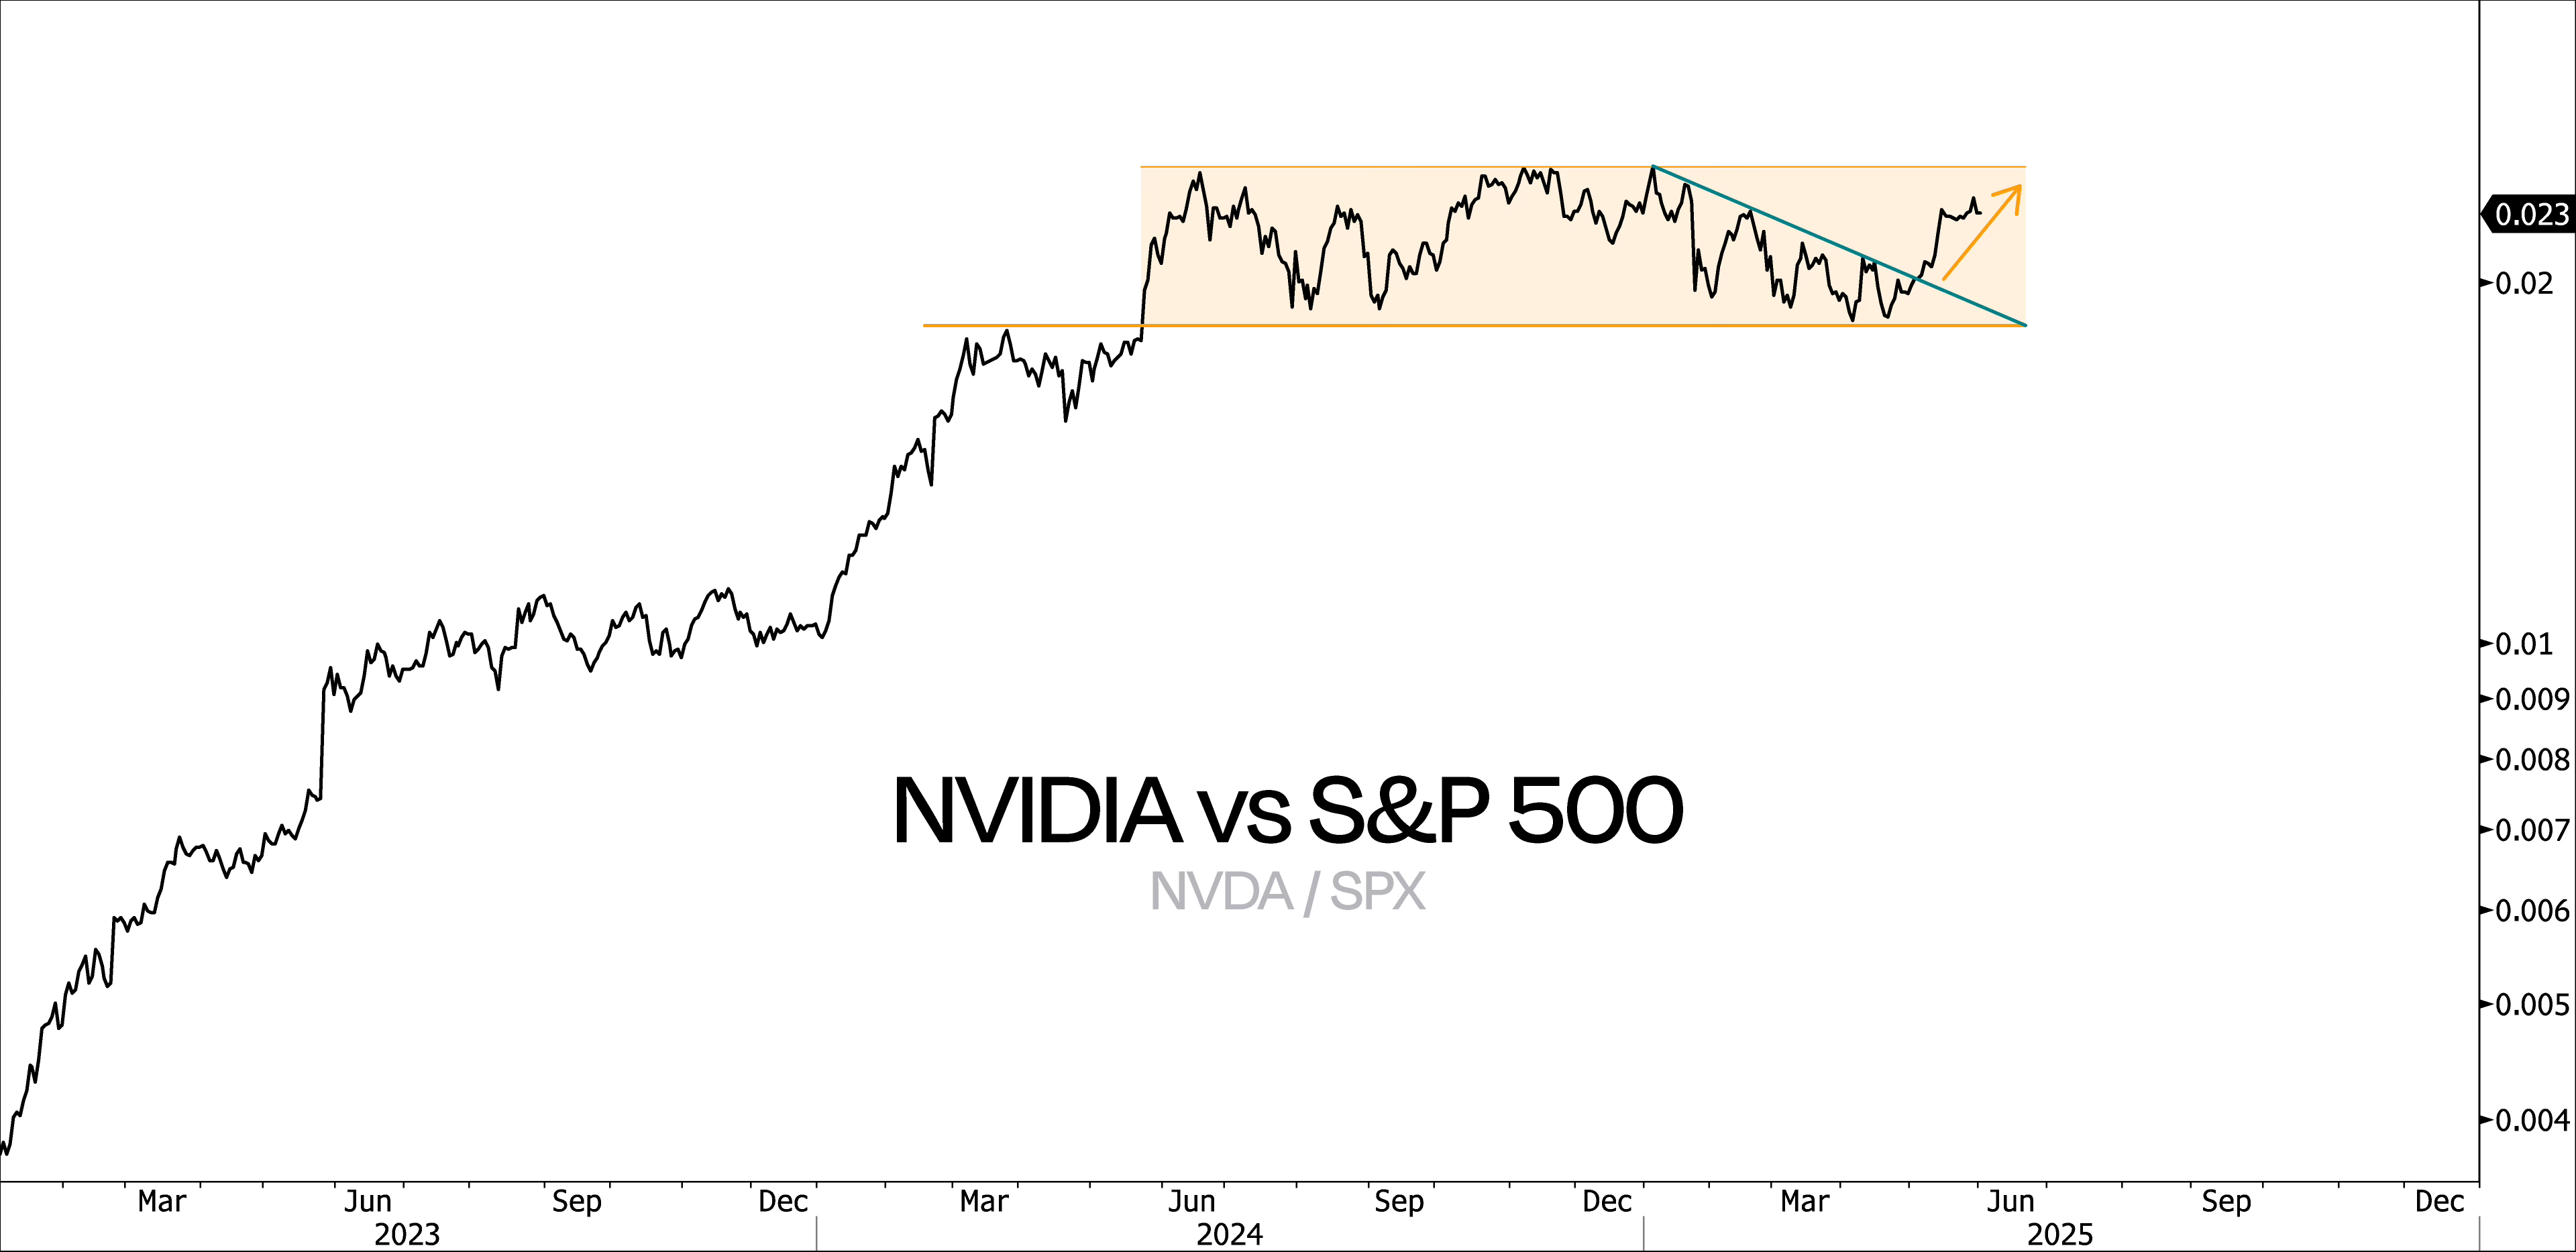
So, we took a look at the relative strength of all seven stocks, and one clearly stands out – NVIDIA.
It’s the one name that has defined leadership throughout this entire bull market.
You can’t talk about this rally without mentioning NVDA.
After a year of going sideways, it finally looks like this sleeping giant is waking up again.
Now, take a look at how NVDA’s stacking up against the S&P 500.
Do you really think this 12-month consolidation won’t resolve in the direction of the underlying trend?
Would you seriously bet against this – in the middle of the largest technological revolution of all time?
Well, if you’re one of those money managers who’s seriously underweight Tech right now, you’re basically betting NVDA won’t break out.
But if you remember what we said about the debasement trade last time, you probably know that’s not a bet you wanna make.
We’re seeing bullish momentum build, strong relative trends, and several names setting up for potential breakouts.
To say the least, the signs are there.